Close Menu
    Facebook X (Twitter) Instagram
    Friday, May 23
    X (Twitter) Instagram LinkedIn YouTube
    Chain Tech Daily
    Banner
    • Altcoins
    • Bitcoin
    • Crypto
    • Coinbase
    • Litecoin
    • Ethereum
    • Blockchain
    • Lithosphere News Releases
    Chain Tech Daily
    You are at:Home » Cardano price flashes bullish signal as MDIA indicator soars
    Crypto

    Cardano price flashes bullish signal as MDIA indicator soars

    James WilsonBy James WilsonMarch 22, 2025No Comments2 Mins Read
    Facebook Twitter Pinterest LinkedIn Tumblr Email
    Share
    Facebook Twitter LinkedIn Pinterest Email


    Cardano price is slowly forming a popular bullish pattern, pointing to a strong bullish breakout in the next few months or weeks.

    Cardano (ADA), a popular proof-of-stake coin, remains in a bear market after plunging by almost 50% from its highest level in November.

    However, some on-chain data and technical indicators point to a strong bullish breakout in the coming weeks or months.

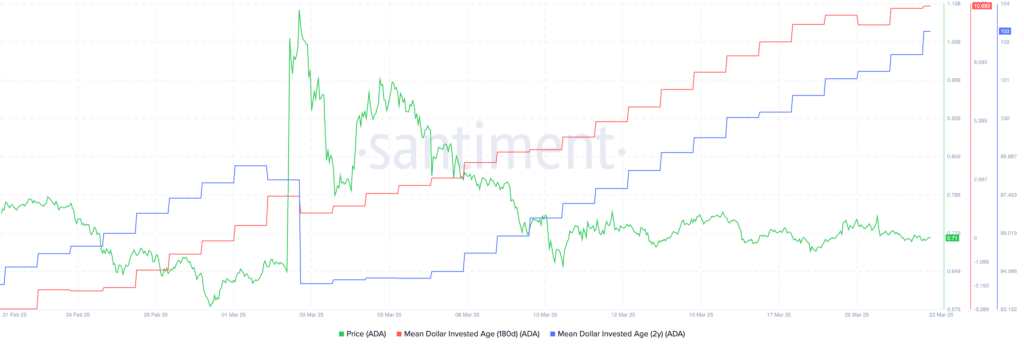
    Santiment data shows that the Mean Dollar Invested Age, or MDIA has continued rising in the past few months. The 180-day MDIA indicator has jumped to 10.68, up from minus 3.2 in February. 

    Similarly, the 2-year MDIA indicator has jumped to 103, up from the year-to-date low of 94. This is a popular indicator that has historically accompanied major rebounds. It tracks the average age of each dollar invested into a coin. 
    Cardano MDIA
    Cardano MDIA indicator | Source: Santiment

    Specifically, the indicator looks at whether older and stagnant wallets circulate their tokens into the market. A rising MDIA indicator is often seen as a bullish sign, while a dropping one shows that they are selling their coins. 

    Cardano, like other cryptocurrencies, has dropped in the past few months. This decline is partly because of profit-taking by some traders after its strong performance in the fourth quarter.

    It is also because of the ongoing fear of President Donald Trump’s tariffs.

    Cardano price technical analysis
    Cardano price
    ADA price chart | Source: crypto.news

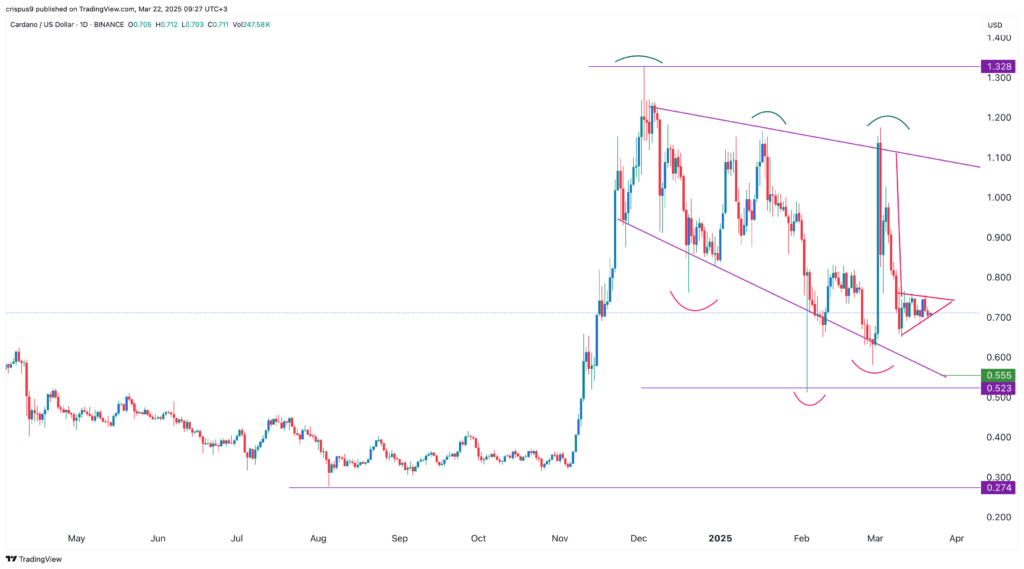
    The daily chart shows that the ADA price has been in a slow downtrend in the past few months. It has dropped from a high of $1.328 in December to $0.70 as it formed a series of lower lows and lower highs. 

    Most recently, the coin has formed a bearish pennant pattern comprising a vertical line and a symmetrical triangle. This pattern usually leads to a strong bearish breakdown. 

    On the positive side, the coin has been forming a falling broadening wedge pattern. This pattern comprises two descending and broadening trendlines.

    In most cases, it often leads to a strong bullish breakout. 

    Therefore, the most likely scenario is where the bearish pennant triggers a drop to the wedge’s lower side at $0.555 and then resumes the uptrend. A rebound may see it rise to the psychological point at $1, followed by last year’s high of $1.32, up by 90% from the current level.


    Source link

    Share. Facebook Twitter Pinterest LinkedIn Tumblr Email
    Previous ArticleMonero spikes as US court ruling sparks privacy coin rally
    Next Article 4 Ripple rivals to consider buying as XRP remains stuck under ATH
    James Wilson

    Related Posts

    Who is a HNI Trader in the Stock Market?

    May 23, 2025

    The full story behind the $260 million breach

    May 23, 2025

    WhalePortal Review – Sentiment and Buying/selling Pressure Heatmaps 2025

    May 23, 2025
    Leave A Reply Cancel Reply

    Don't Miss

    Who is a HNI Trader in the Stock Market?

    The full story behind the $260 million breach

    WhalePortal Review – Sentiment and Buying/selling Pressure Heatmaps 2025

    Google I/O 2025: The AI Revolution

    About
    About

    ChainTechDaily.com is your daily destination for the latest news and developments in the cryptocurrency space. Stay updated with expert insights and analysis tailored for crypto enthusiasts and investors alike.

    X (Twitter) Instagram YouTube LinkedIn
    Popular Posts

    Who is a HNI Trader in the Stock Market?

    May 23, 2025

    The full story behind the $260 million breach

    May 23, 2025

    WhalePortal Review – Sentiment and Buying/selling Pressure Heatmaps 2025

    May 23, 2025
    Lithosphere News Releases

    Colle AI Expands Bitcoin-Powered Capabilities to Unlock Scalable NFT Asset Distribution

    May 23, 2025

    Atua AI Enhances Financial Automation Through Deeper XRP Cryptocurrency Infrastructure Scaling

    May 23, 2025

    Africa’s green future lies in industrial cities

    May 21, 2025
    Copyright © 2025

    Type above and press Enter to search. Press Esc to cancel.