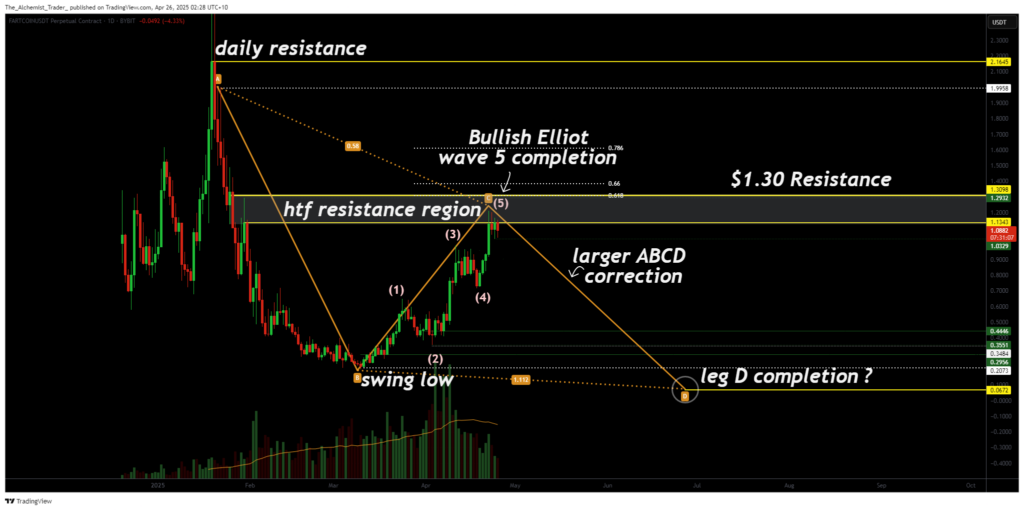
Fartcoin has approached a major inflection zone after completing a potential Elliott Wave structure. The token’s recent price action suggests a shift in market dynamics, and traders are watching closely for signs of a larger corrective move.
Fartcoin (FARTCOIN) currently encountering a critical resistance level that aligns with the end of a bullish five-wave Elliott structure and the start of a larger wave D of an ABCD corrective phase. After an extended rally, the market is showing signs of fatigue, which could result in a shift from impulsive to corrective behavior. This transition phase is pivotal, as it may define the next macro trend for Fartcoin.
Key technical points
- FART has completed a textbook five-wave bullish Elliott Wave formation.
- The $1.15–$1.30 region is acting as a bearish order block with no sustained candle closures above.
- A macro ABCD correction may be forming, indicating a larger downtrend may follow.

The structure of Fartcoin’s recent uptrend resembles a completed Elliott Wave 5, with each subwave clearly visible. Typically, after such a structure, markets transition into corrective phases, often in the form of ABC or more complex ABCD patterns.
The rejection near $1.15, with multiple failed attempts to close above $1.30, signals strong supply and bearish sentiment at these levels.
Adding further weight to this analysis, the $1.30 region has now formed what appears to be a bearish order block on the daily chart. Historically, this level was a zone of aggressive selling pressure, and price has once again failed to accept above it. The lack of follow-through volume or momentum suggests that market buyers are weakening.
Looking at the broader timeframe, Fartcoin may be initiating a macro ABCD correction. If this plays out, it could take several weeks or even months to develop fully. Still, the implications are significant, it could mean a revisit of previous lows or even the formation of new ones.
This aligns with Elliott Wave Theory, which posits that after five impulsive waves, a correction usually follows before the market resumes its trend direction or continues to consolidate.
Outlook for price development
Given current technicals, Fartcoin appears to be entering a period of reassessment. A breakdown from this region would confirm a macro lower high and validate the beginnings of a deeper retracement. Price action will need to either break through the $1.30 resistance with conviction or confirm rejection by forming a lower high below it.
If bulls fail to retake the level convincingly, traders may begin targeting the $0.90–$1.00 support range as a first stop, with further downside potential extending to previous swing lows.


