


XRP price has fallen more than 5% from its recent high as bearish technical signals and weakening derivatives activity have pushed the token toward a key support zone near $1.
Summary
- XRP price fell more than 5% after a failed breakout above $1.16 triggered heavy selling and a slump in futures activity.
- A bearish MACD crossover and loss of key Fibonacci support have increased the risk of a drop toward $1.05 and potentially $1.
- Weak network activity, macroeconomic uncertainty, and strong resistance between $1.14 and $1.17 continue to pressure price action.
According to data from crypto.news, XRP (XRP) price has dropped from a June 22 high of $1.16 to around $1.10 today, June 23, extending losses after buyers failed to hold a breakout above a major resistance area.
XRP price drop accelerated during late June 22 trading when volume surged to 65.4 million XRP, roughly 84% above the weekly average. This jump in selling activity came as XRP was rejected near the upper boundary of a multi-week descending channel, a level that has capped recovery attempts since late May.
At the same time, derivatives markets showed signs of weakening participation. Falling futures open interest and reduced leveraged positioning removed a key source of buying support, leaving spot markets vulnerable to a rapid pullback.
As traders unwound bullish bets, XRP slipped through several short-term support levels and extended its decline toward the lower end of its recent trading range.
Technical indicators point to the $1.05 support zone
On the 4-hour price chart, XRP price is close to breaking below the 78.6% Fibonacci retracement level near $1.118, a support area that had previously slowed selling pressure. The move has shifted attention to the next major downside target around $1.05, which aligns with both the June swing low and the lower boundary of the Fibonacci structure.
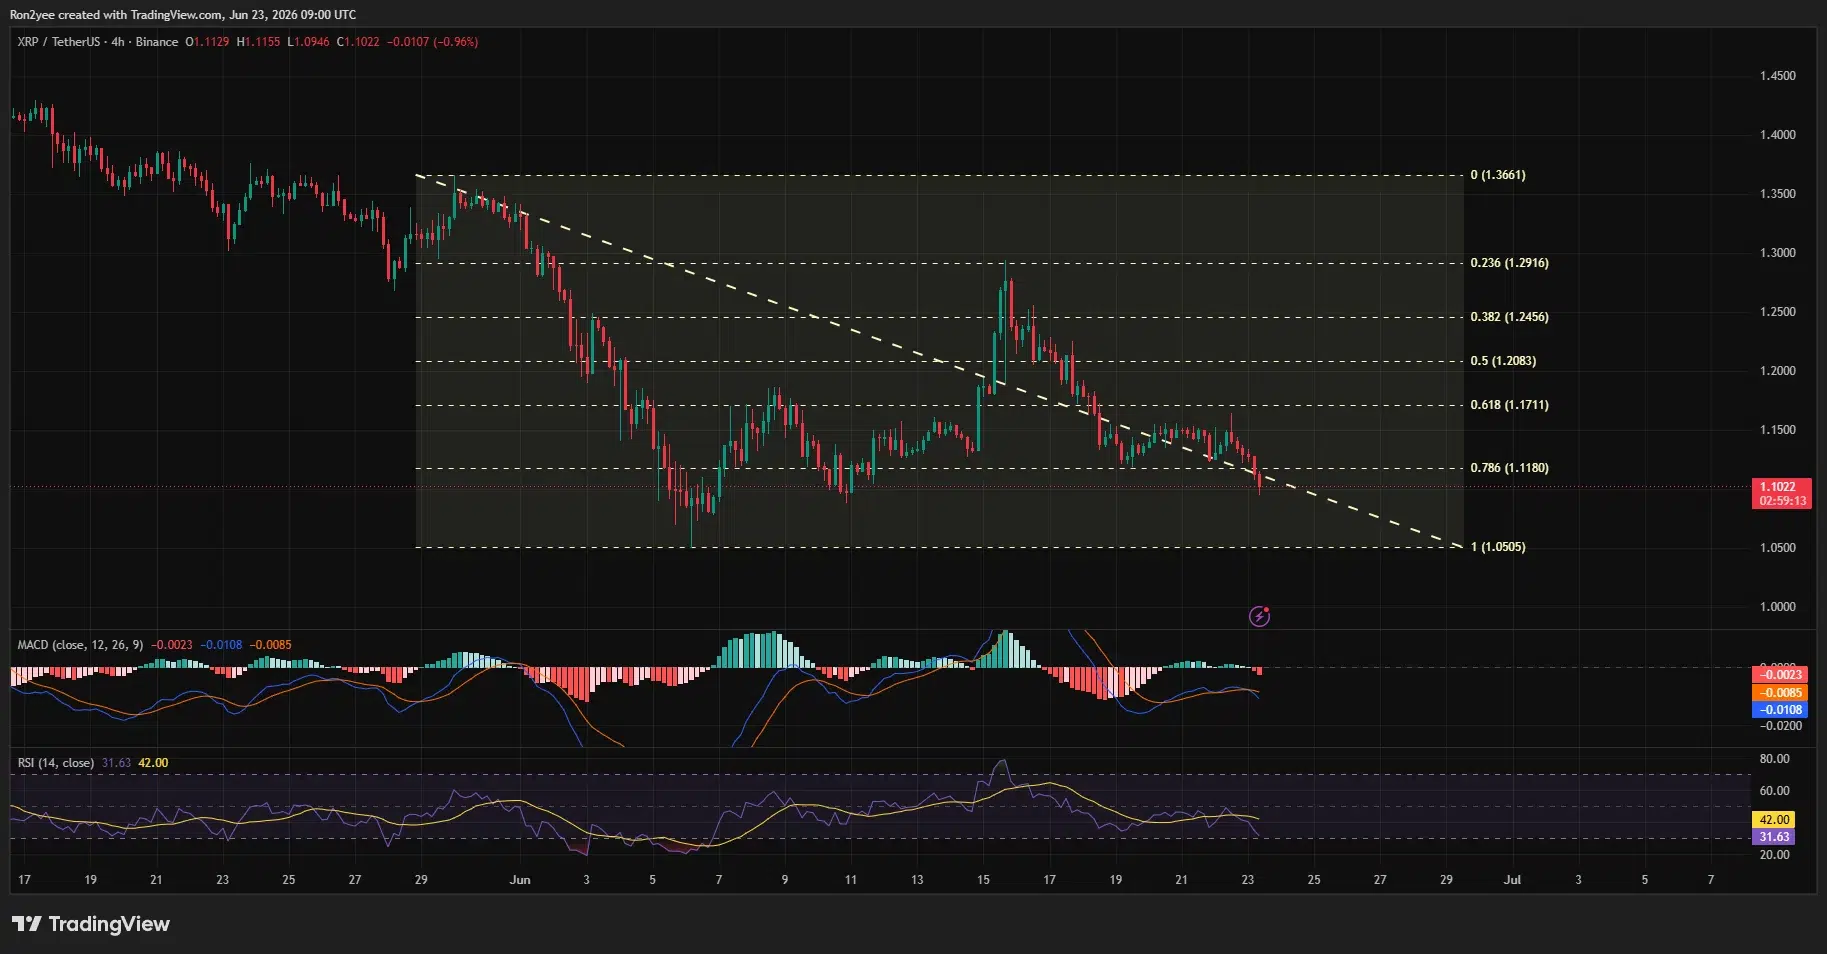
Additional indicators continue to favor sellers. The MACD on the four-hour timeframe has produced a bearish crossover, with the signal line remaining below zero. Meanwhile, the Relative Strength Index has fallen to near 32, placing XRP close to oversold territory but without showing a confirmed reversal signal.
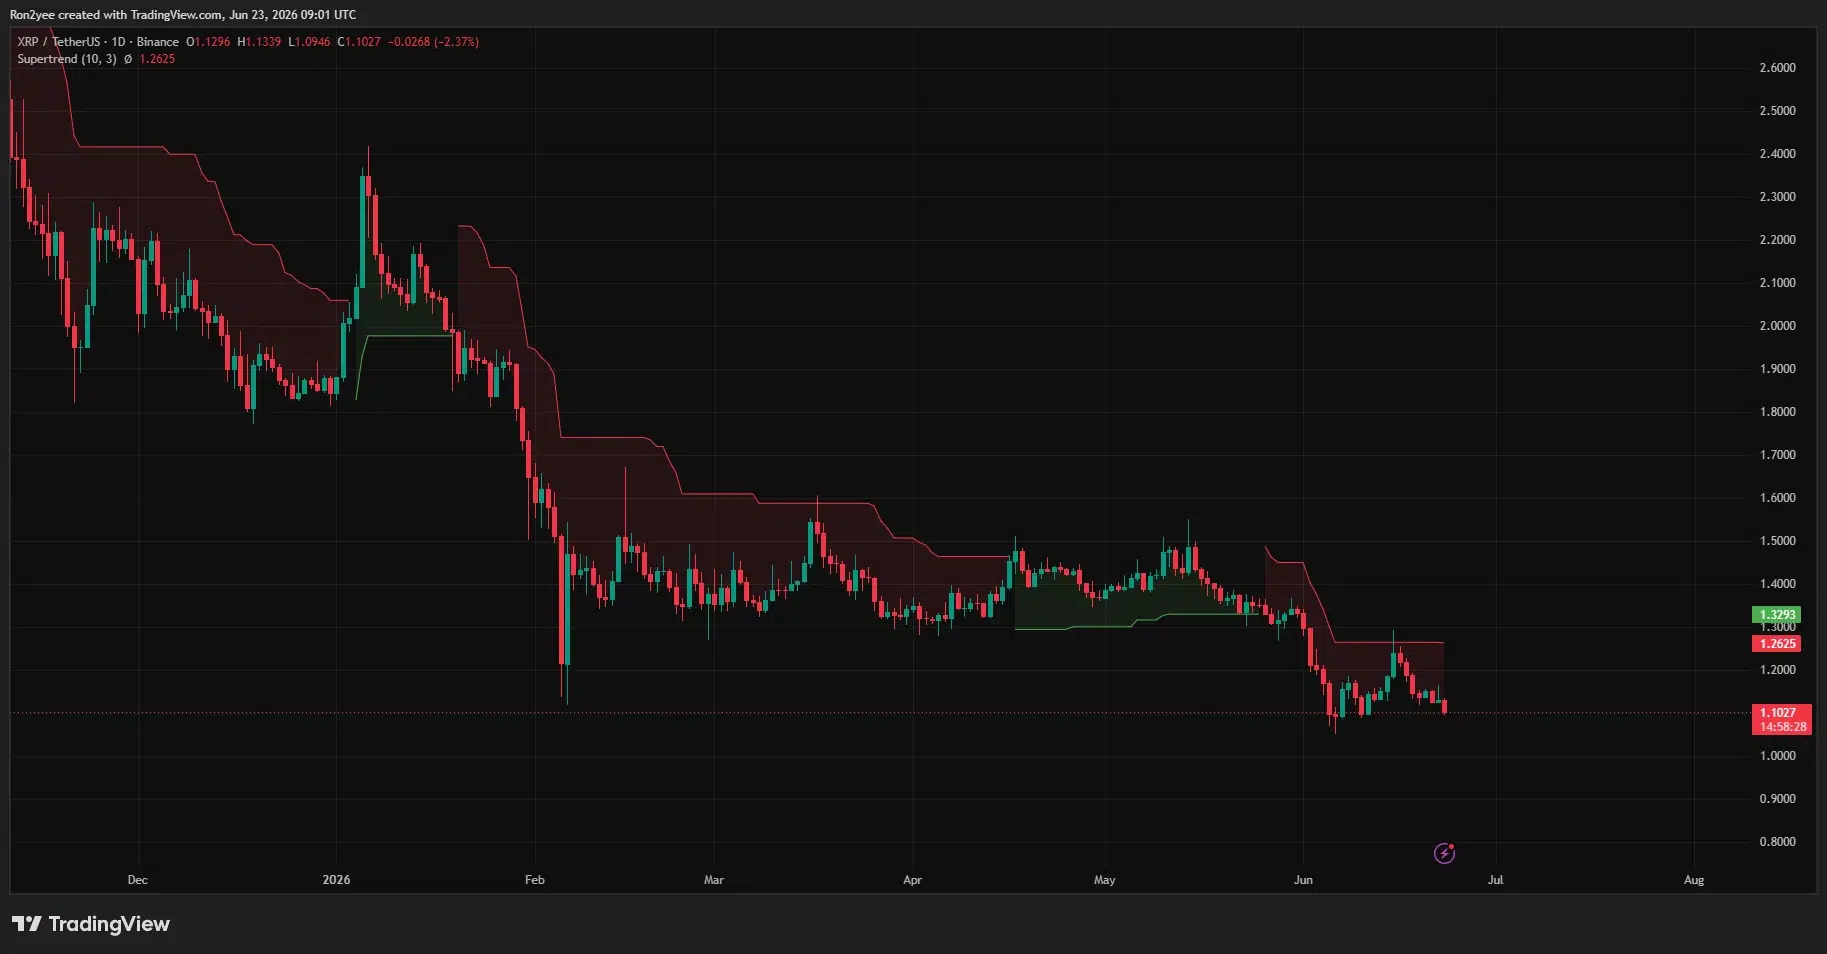
The daily chart data adds further strength to the bearish case. XRP remains below the Supertrend indicator, which currently sits near $1.26 and has acted as dynamic resistance throughout the year. A series of lower highs and lower lows continues to define the market structure, keeping downward momentum intact.
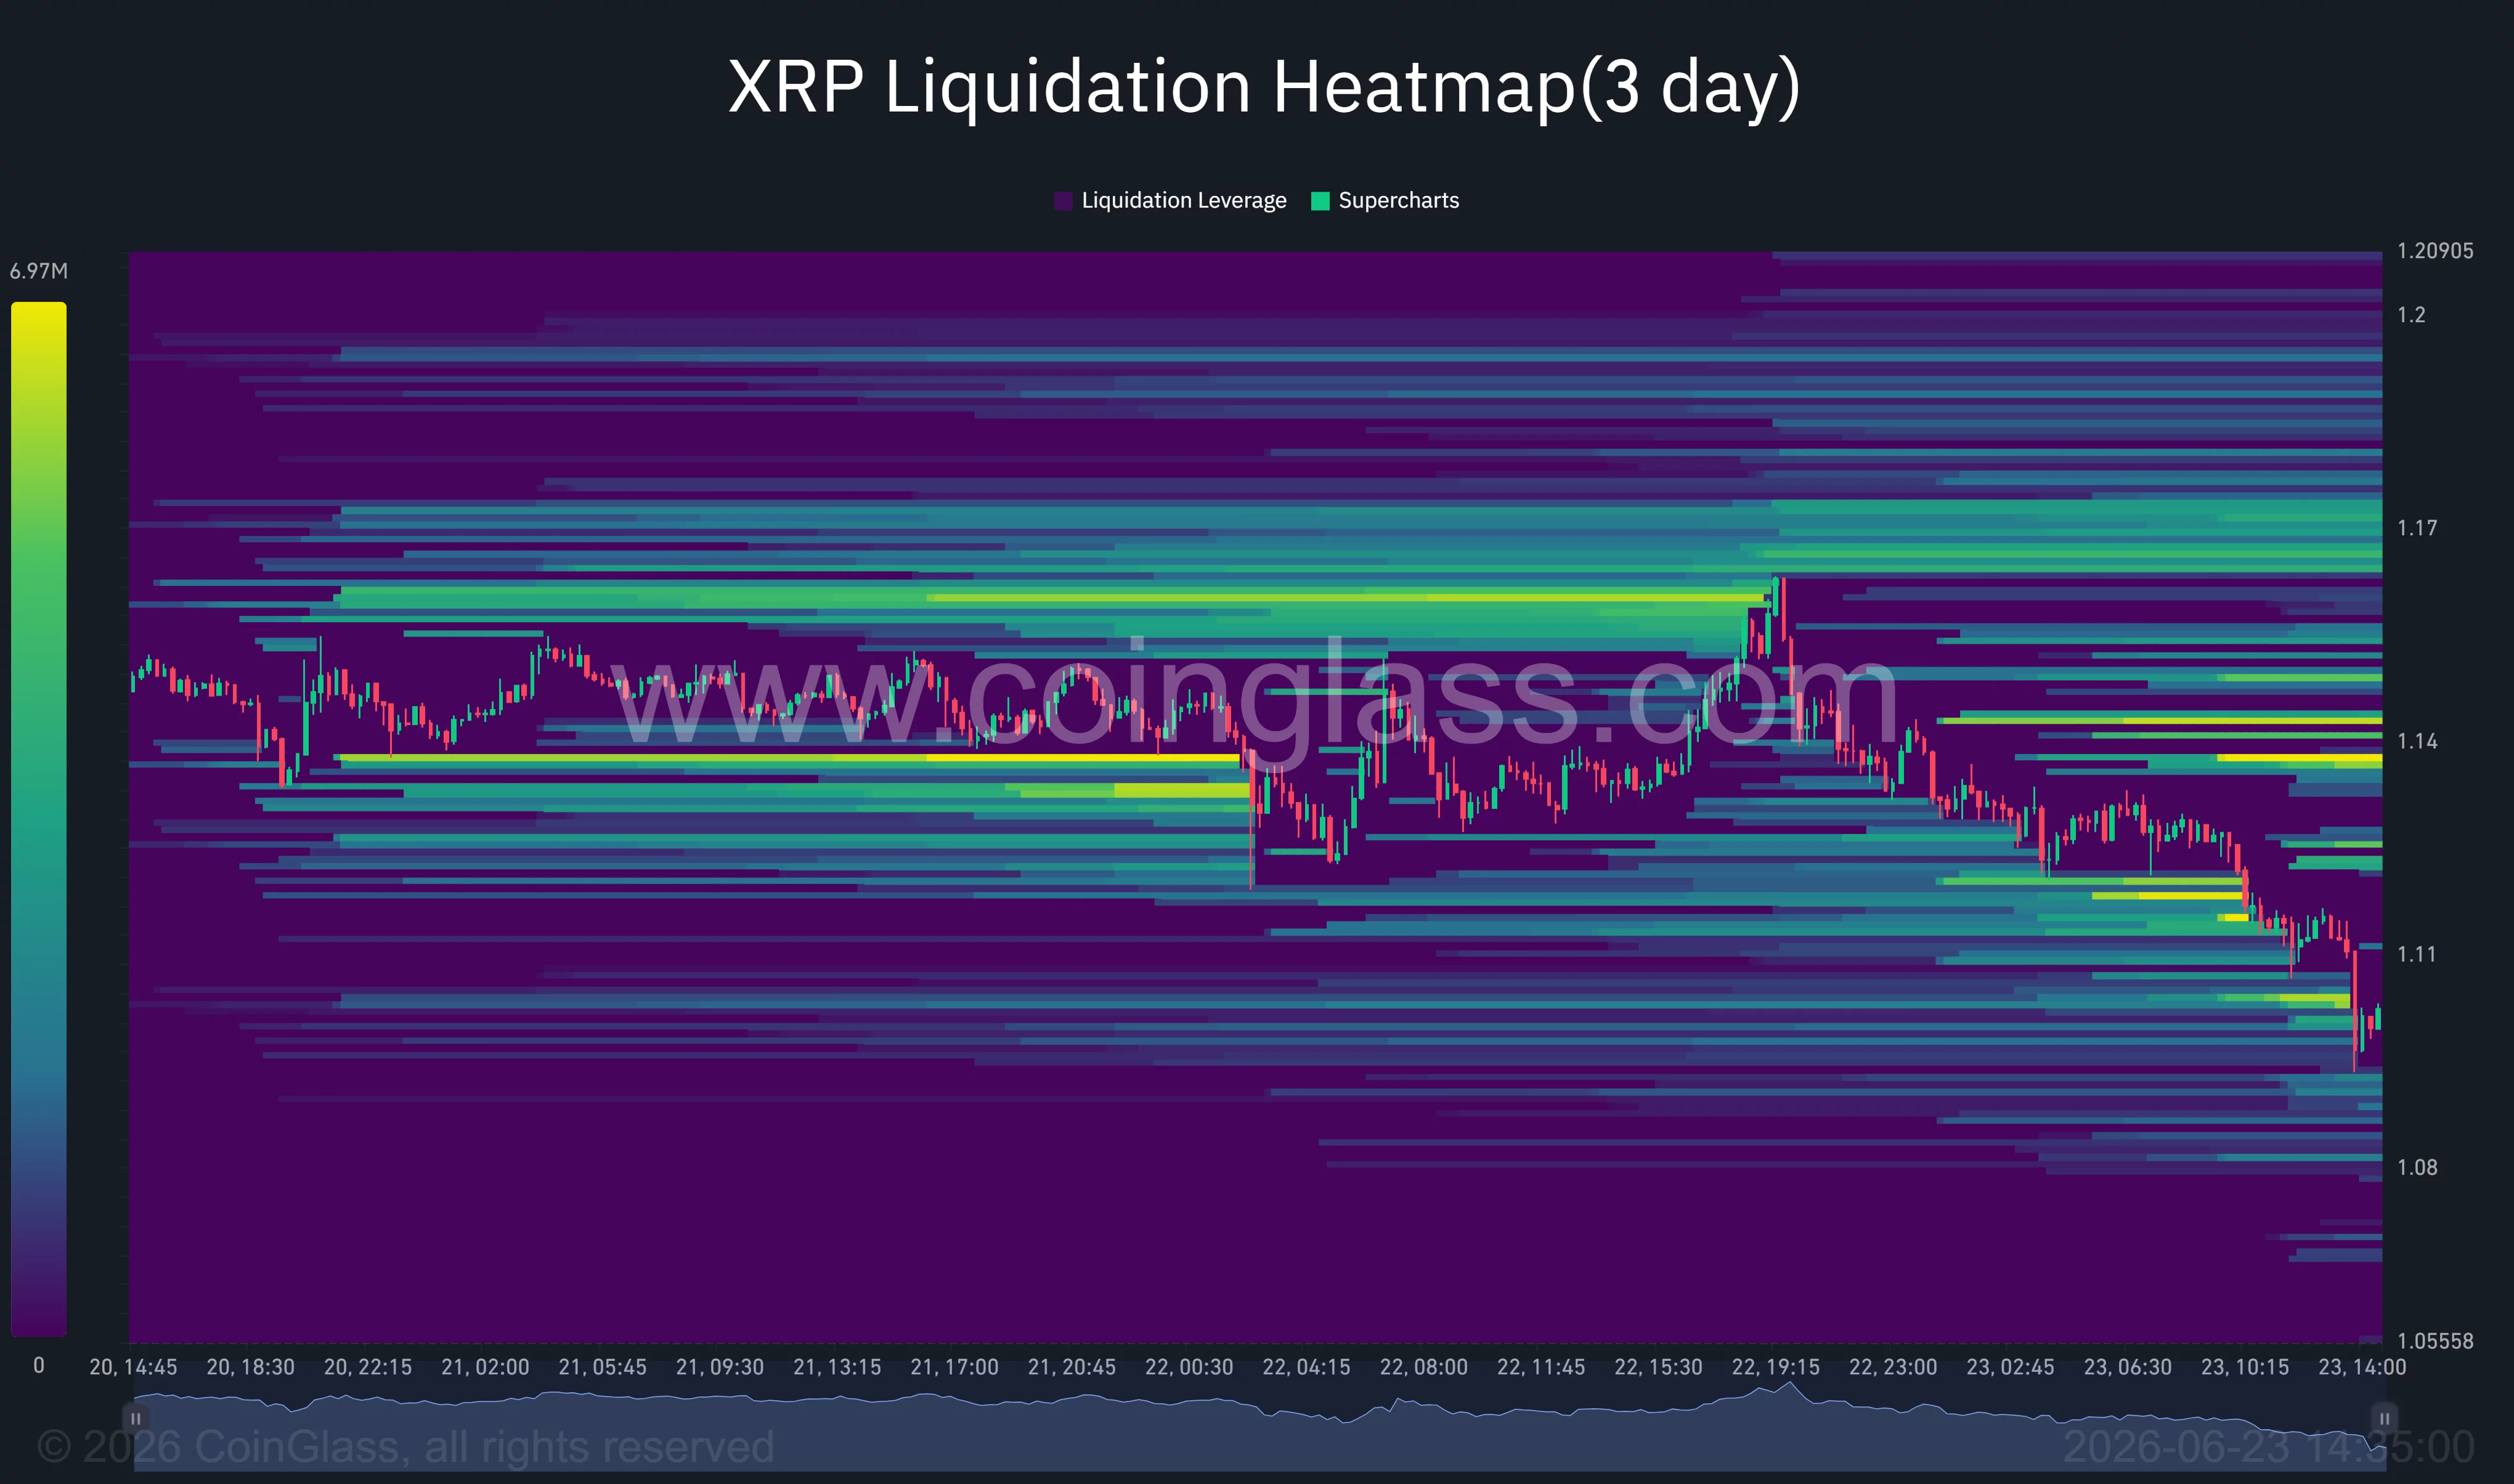
Liquidation data from CoinGlass also highlights strong resistance overhead. The largest concentration of leveraged positions is clustered between $1.14 and $1.17, creating a zone where short sellers may continue defending rallies. Additional liquidity sits near $1.19 and $1.20, making any recovery attempt more difficult unless buying demand strengthens significantly.
Macro pressure and weak network activity weigh on sentiment
Outside technical factors, XRP has faced pressure from a deteriorating risk environment across financial markets. A sell-off in major technology and semiconductor stocks has reduced appetite for speculative assets, while geopolitical tensions in the Middle East have increased uncertainty across global markets.
Rising concerns about inflation and interest rates have encouraged investors to favor lower-risk assets and yield-generating instruments. Under those conditions, cryptocurrencies and other risk-sensitive assets have struggled to attract fresh capital.
Network activity has also softened in recent weeks. While institutional investment products tied to XRP have continued to record cumulative inflows over recent months, spot market demand has weakened. Lower transaction activity and reduced retail participation have limited organic buying pressure, leaving the token exposed to sudden liquidity gaps during periods of market stress.
Unless XRP can reclaim the heavily contested $1.14-$1.17 zone identified by CoinGlass data, traders may continue focusing on the $1.05 support area.
A break below that level could open the door for a move toward the psychological $1 mark, which would represent the next major downside target on the chart.
Disclosure: This article does not represent investment advice. The content and materials featured on this page are for educational purposes only.