



Bitcoin traded near $63,490 on July 28 after falling below $64,000 during a broad risk-off move across Asian markets.
Summary
- Bitcoin traded near $63,490, down 2.85%, as South Korea’s KOSPI triggered a circuit breaker Tuesday.
- $11.64 million left U.S. spot Bitcoin ETFs Monday, while IBIT posted the largest fund outflow.
- Wallets holding 10 to 10,000 BTC accumulated 19,696 coins during the latest eight-day period tracked.
According to crypto.news market data, BTC dropped about 2.85% over 24 hours, with a daily range between approximately $63,055 and $65,546 at the time checked.
The decline began after U.S. markets closed Monday and accelerated as South Korean technology shares sold off. Bitcoin dropped from nearly $65,000 to around $63,200 before recovering slightly, while ether, XRP and solana also weakened.
The move places BTC back inside the lower half of its recent $60,000–$66,000 range. Technical momentum has softened, although compressed volatility, whale accumulation and the approaching Federal Reserve decision leave the next direction unsettled.
Asian equity losses added pressure to Bitcoin price
South Korea’s KOSPI fell more than 8% on Tuesday morning, forcing the Korea Exchange to suspend marketwide trading for 20 minutes. The Level 1 circuit breaker was activated after the decline remained above the required threshold for one minute.
Selling continued after the halt. The KOSPI fell almost 10% during the session, while Samsung Electronics and SK Hynix lost more than 12%. Concerns centred on heavy AI spending, financing risks and growing competition from Chinese semiconductor companies.
Japan’s Nikkei also fell about 4%, following a 2.2% decline in the Philadelphia Semiconductor Index during Monday’s U.S. session. Nvidia had dropped 5%, adding another negative signal for technology-linked risk assets.
Bitcoin often trades alongside equities when selling is driven by interest rates, liquidity or broad macro concerns. However, the relationship is not constant. Bitcoin may decouple when pressure is limited to company earnings or sector-specific capital-spending concerns.
Tuesday’s price action suggests traders initially treated the Asian selloff as a wider risk event. It does not prove that the KOSPI decline alone caused Bitcoin’s fall, because Fed expectations, ETF flows and geopolitical developments were moving simultaneously.
Bitcoin remains trapped between $60,000 and $66,000
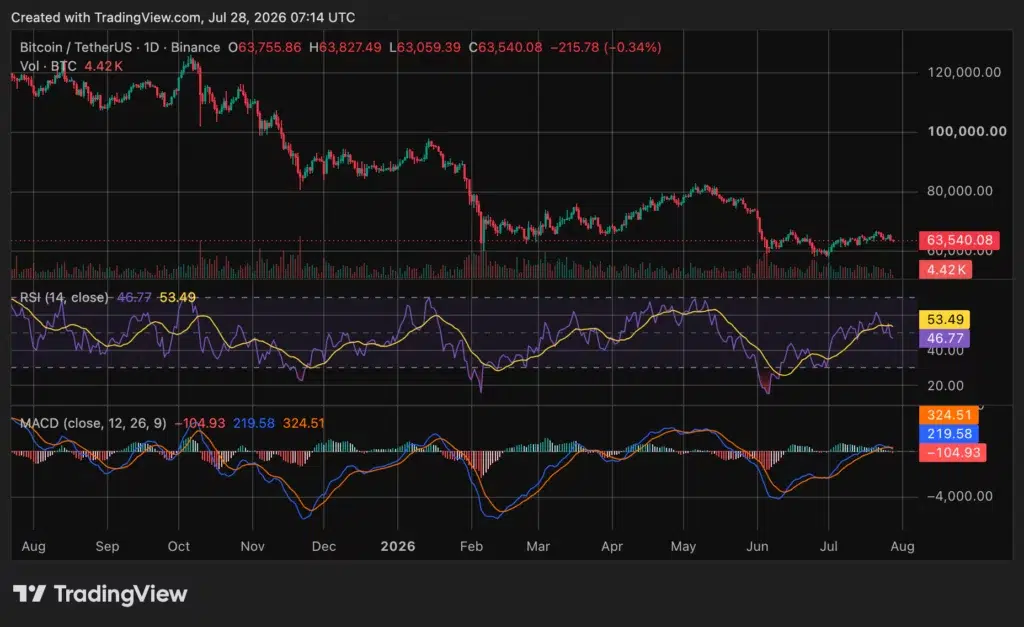
The BTC/USDT daily chart places Bitcoin near $63,500 after repeated failures to establish support above $65,000–$66,000. Price has consolidated since June’s sharp decline, but it remains in a broader downtrend from the previous peak above $100,000.
The relative strength index on the supplied chart stands at 46.77, below its moving average of 53.49. An RSI reading below 50 shows that short-term momentum has moved slightly towards sellers, although it remains well above the traditional oversold level of 30.
Bitcoin price chart, source: crypto.news
The moving average convergence divergence indicator has also weakened. Its histogram is negative at about minus 104.93, while the MACD line near 219.58 remains below the signal line around 324.51. That structure shows that the earlier July recovery has lost momentum.
Ali Martinez said Bitcoin’s three-day Bollinger Bands were beginning to squeeze. Bollinger compression usually reflects falling realised volatility and can precede a larger move, but it does not establish whether the eventual break will be higher or lower.
Crypto Patel separately argued that BTC had broken trendline support, retested approximately $65,600 and faced rejection. His bearish scenario targets the 0.618 Fibonacci area near $61,000 while price remains below reclaimed resistance. That level is an analyst projection, not a confirmed destination.
The chart therefore presents three immediate zones. Bitcoin must recover $65,000–$66,000 to improve its short-term structure. The $61,000 area is the first lower support identified by the bearish Fibonacci setup, while $60,000 remains the main floor of the broader consolidation.
A sustained daily close below $60,000 would weaken the range and expose the June lows near $58,000. Conversely, a close above $66,000 would invalidate part of the short-term bearish setup and place the July resistance near $67,181 back in focus.
Bitcoin reclaimed $65,000 on July 27 as falling oil prices briefly supported risk assets. That recovery failed to produce a breakout above the wider resistance band.
ETF selling conflicts with whale accumulation
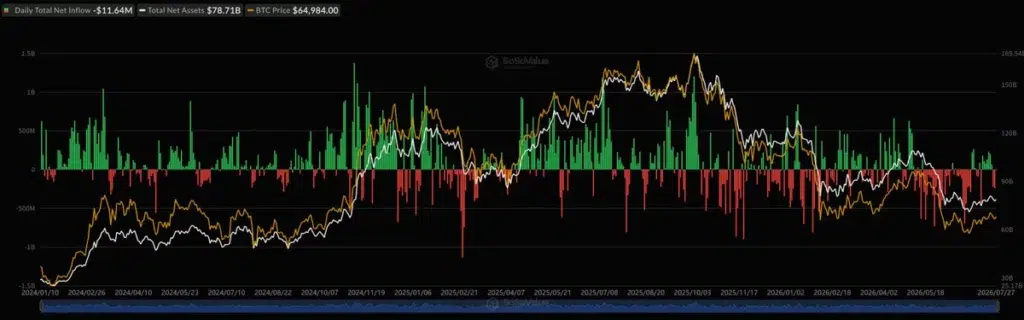
U.S. spot Bitcoin ETFs recorded combined net outflows of $11.64 million on July 27, according to SoSoValue data. BlackRock’s iShares Bitcoin Trust recorded the largest individual fund outflow at $8.82 million.
Bitcoin spot ETF net inflow, Source: SoSoValue
The daily total was modest compared with the $240.08 million withdrawn on July 24. However, another negative session shows that institutional demand remains uneven rather than firmly returning to sustained inflows.
ETF activity has become an important source of marginal Bitcoin demand. Persistent inflows require authorised participants to create shares and source underlying exposure, while extended outflows can reduce that source of buying.
One session should not be treated as a trend. The four-week flow direction offers a more useful measure because individual daily totals can be affected by portfolio rebalancing, market making and settlement timing.
On-chain data present a different picture. Santiment said wallets holding between 10 and 10,000 BTC added 19,696 BTC over eight days. The analytics firm also said wallets holding less than 0.01 BTC showed weaker dip-buying activity.
The divergence suggests larger holders have accumulated while very small accounts have shown less urgency. Still, wallet cohorts do not map perfectly to individual investors. Large addresses can represent exchanges, custodians, funds or several customers rather than one whale.
Whale accumulation may provide support if those coins remain off exchanges. It becomes less constructive if large holders begin transferring inventory to trading platforms during price rebounds.
Fed, GDP and core PCE create a volatility window
The Federal Open Market Committee is meeting on July 28 and 29. At its previous meeting on June 17, the Fed kept the federal funds target range at 3.5%–3.75% and said inflation remained above its 2% goal.
Interest-rate markets assigned a roughly 38% probability to a 25-basis-point increase before the decision. That estimate represents market pricing and can change quickly before the announcement.
The July meeting is not marked as one accompanied by a new Summary of Economic Projections. Traders will therefore focus on the rate decision, the statement and the central bank’s language about inflation, energy prices and future tightening.
Thursday brings two major U.S. releases at 8:30 a.m. Eastern Time. The Bureau of Economic Analysis will publish its advance estimate of second-quarter gross domestic product and the June Personal Income and Outlays report, which contains the Fed’s preferred personal consumption expenditures inflation measures.
A rate increase or a more restrictive statement could lift Treasury yields and the dollar, conditions that often weigh on Bitcoin and other assets without fixed cash flows. Under that scenario, the $61,000 and $60,000 zones would become more exposed.
A rate hold accompanied by less restrictive guidance could help BTC challenge $65,000–$66,000 again. Cooler core PCE data on Thursday could support that move, while stronger inflation or GDP figures could renew expectations that rates must remain higher.
The outcomes should not be considered in isolation. A hold on Wednesday could initially lift Bitcoin, only for hotter inflation data to reverse the move on Thursday. Likewise, a restrictive Fed decision could be partly offset by weaker economic data the following day.
As previously reported, Bitcoin entered July with the Fed meeting and ETF flows as its main external catalysts. The earlier analysis identified $58,000 as major downside support, while the market has since established a nearer resistance zone around $65,000–$67,181.
Bitcoin needs confirmation outside the current range
Bitcoin’s immediate trend remains neutral to mildly bearish while price trades below $65,000–$66,000. The negative MACD histogram and sub-50 RSI support that reading, but neither indicator confirms a full breakdown while $60,000 remains intact.
A bullish confirmation would require a sustained close above $66,000, preferably accompanied by stronger spot volume and renewed ETF inflows. That would return attention to $67,181 and the higher resistance area near $68,000.
A bearish confirmation would require a decisive close below $60,000. Such a move would break the current consolidation and bring the late-June low near $58,000 back into view.
Until either boundary fails, Bitcoin remains range-bound. The Bollinger Band squeeze suggests that volatility may expand soon, while the Fed decision, GDP release and core PCE data provide clear events capable of triggering that expansion.
FAQs
Why is Bitcoin falling today?
Bitcoin weakened as South Korean and Japanese technology shares sold off, U.S. semiconductor stocks declined and traders prepared for the Federal Reserve decision. Fresh ETF outflows added another negative signal, although no single factor fully explains the move.
Is $60,000 the key Bitcoin support?
Yes. Bitcoin has repeatedly traded between approximately $60,000 and $66,000 since the June selloff. The $61,000 level may offer earlier Fibonacci support, but a daily close below $60,000 would represent a clearer range breakdown.
Does the Bollinger Band squeeze predict a rally?
No. A squeeze shows that volatility has contracted. It can precede a strong price move, but it does not predict the direction. Price confirmation above resistance or below support is still required.
When are the Fed, GDP and core PCE events?
The Fed’s two-day meeting ends Wednesday, July 29. The advance second-quarter GDP estimate and June Personal Income and Outlays report are scheduled for Thursday, July 30, at 8:30 a.m. Eastern Time.
