



Bitcoin price extended its decline below $78,000 on Sept. 10 as fading momentum, elevated Treasury yields and caution before U.S. inflation data kept buyers on the sidelines.
Summary
- Bitcoin price fell to an intraday low of $77,688 after failing to hold above $78,000.
- Daily MACD momentum turned bearish, while RSI retreated from near-overbought levels.
- Liquidation clusters sit near $77,300 below and between $80,500 and $81,800 above.
- Analysts view the wider $76,000 to $81,000 area as a volatile range without a clear trend.
Bitcoin price falls below $78,000
According to data from crypto.news, Bitcoin (BTC) price traded near $77,800 at the time of writing after opening the daily session at $78,306. The cryptocurrency reached an intraday high of $78,564 before sellers pushed it as low as $77,688.
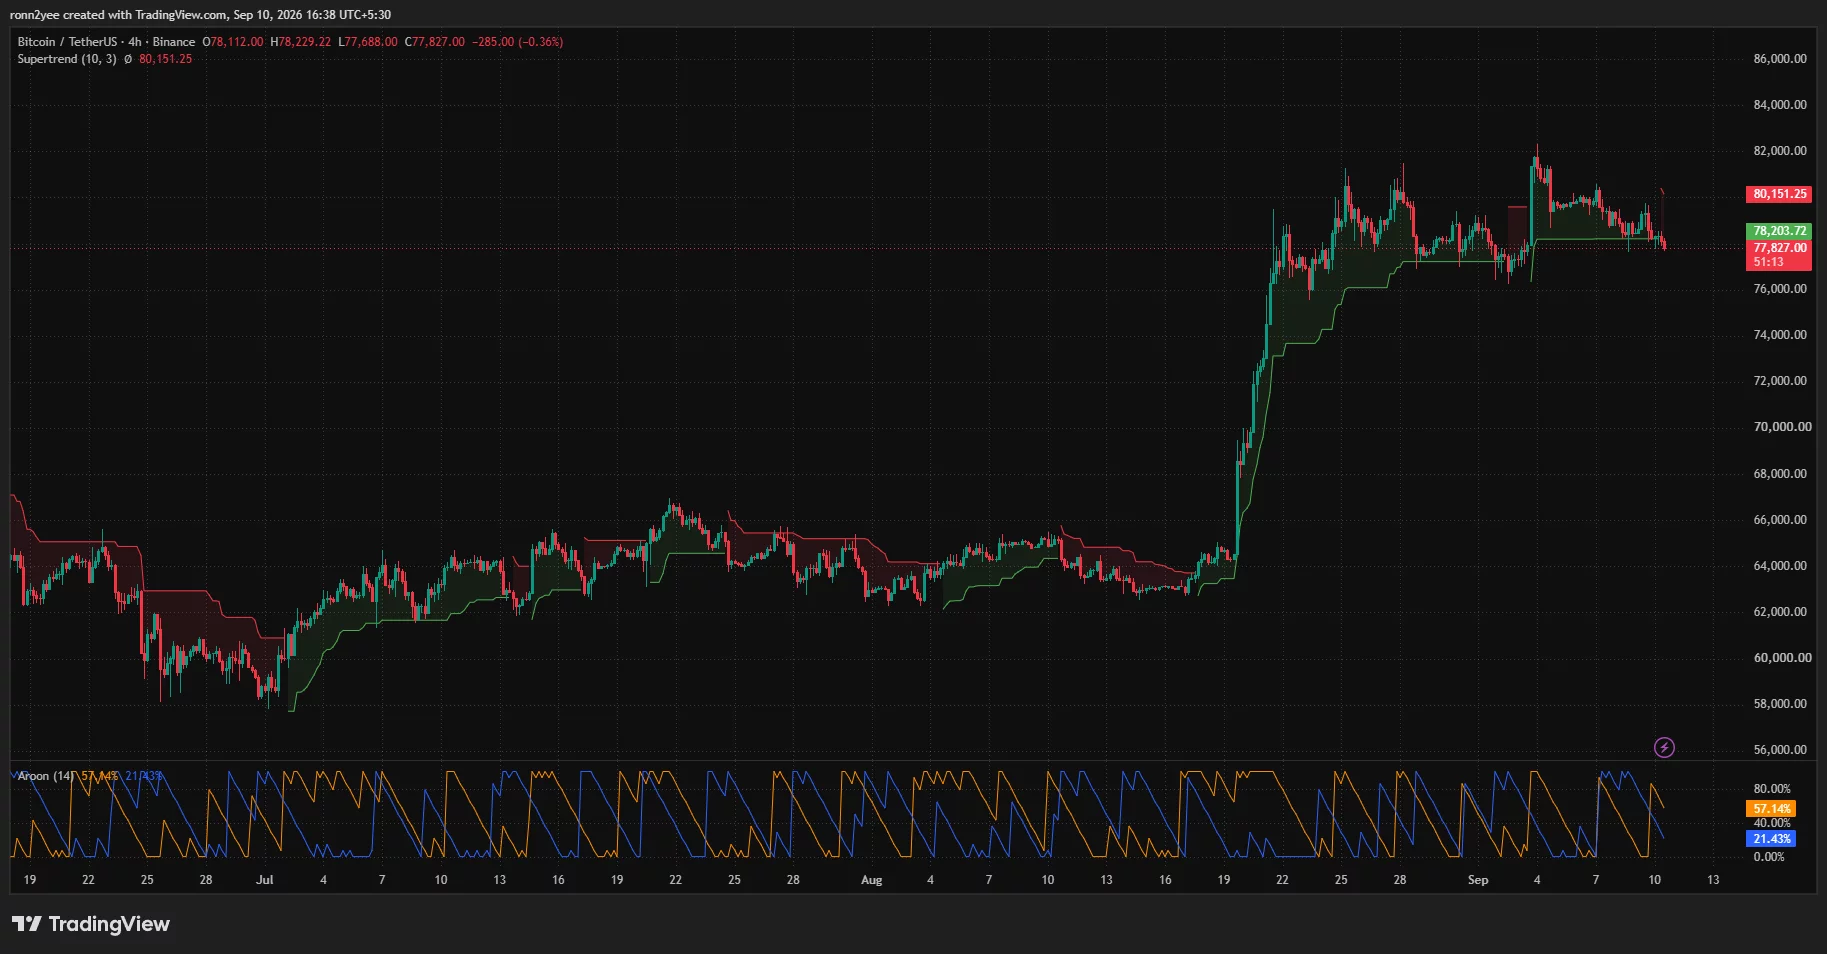
The move extended the pullback from the Sept. 3 peak near $82,280. Bitcoin has since formed a series of lower highs on the 4-hour chart, showing that buyers have struggled to maintain each rebound.
Price also slipped below the 4-hour Supertrend level around $78,203. The indicator will continue to favor sellers unless Bitcoin recovers that mark and holds above it on a closing basis.
A stronger resistance area sits near $80,151, where the previous Supertrend barrier overlaps with recent intraday highs. Bitcoin repeatedly failed to sustain moves above $80,000 during the past week, making the psychological level an important test for any recovery attempt.
Crypto trader Daan Crypto Trades said Bitcoin had recorded its fifth drawdown of between 4% and 6% over the past three weeks. Despite the repeated declines, the analyst noted that BTC remained inside a broader range between $76,000 and $81,000.
According to Daan, volatility has increased without producing a clear directional trend. He said traders may need to wait for a confirmed break from the range before assuming that Bitcoin has started a larger move.
US inflation risks limit demand for Bitcoin
Bitcoin’s latest decline came as markets prepared for U.S. producer and consumer inflation reports ahead of the Federal Reserve’s Sept. 15–16 meeting.
Oil prices above $100 per barrel have revived concerns that energy costs could keep inflation elevated. Higher inflation readings could strengthen the case for the Fed to maintain restrictive monetary policy or raise rates.
U.S. Treasury yields also remained elevated as investors assessed inflation risks and growing government borrowing. The 10-year yield traded near 4.86%, while the 30-year yield approached 5.31%.
Higher bond yields can reduce demand for Bitcoin and other non-yielding assets because Treasury securities offer investors a fixed return. The same pressure has encouraged some U.S. ETF investors to favor short- and intermediate-term bond funds, according to Reuters.
Uncertainty around the inflation figures has also made it harder for spot Bitcoin demand to offset selling in the derivatives market. Leveraged positions can intensify short-term moves when price crosses heavily traded liquidation levels, particularly during periods of weak spot buying.
The Federal Reserve’s decision remains the main U.S. catalyst for Bitcoin. Markets are weighing whether policymakers will hold the federal funds target range at 3.50% to 3.75% or raise it by 25 basis points.
Momentum indicators turn lower
Bitcoin’s daily chart still shows a broader recovery from its June and July lows, but short-term indicators have weakened.
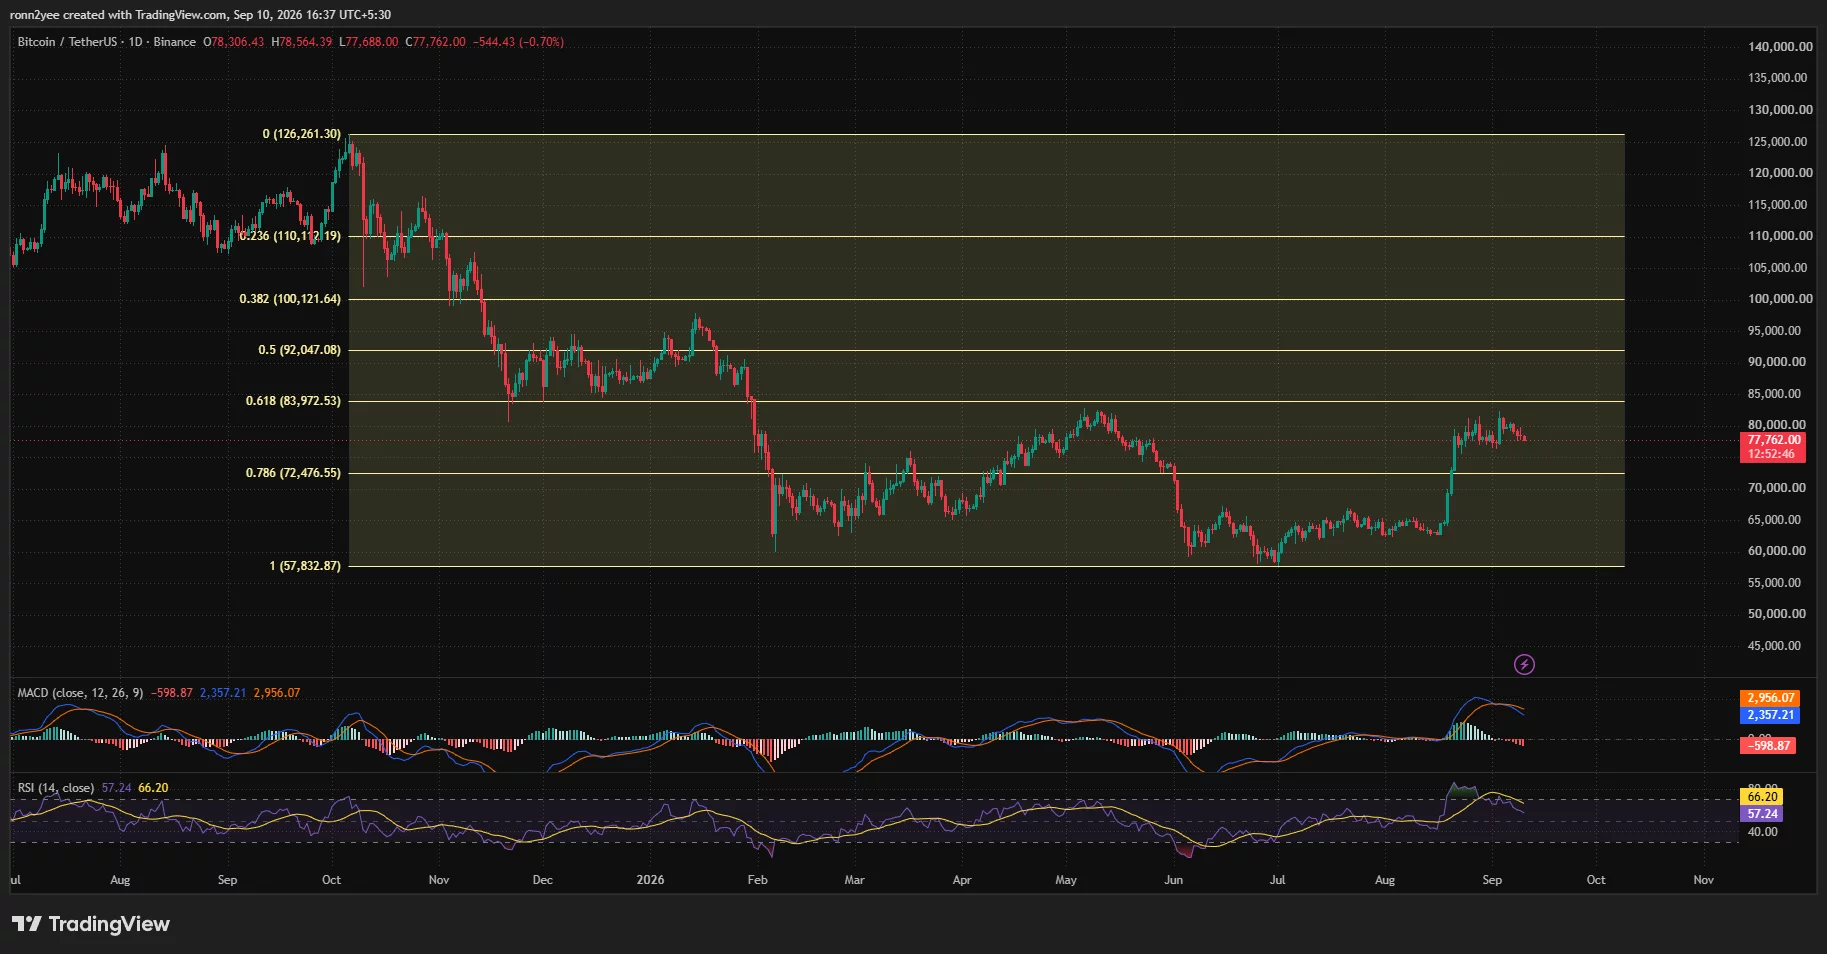
The daily relative strength index fell to 57.24 from its recent elevated reading, while its moving average stood at 66.20. An RSI above 50 generally shows that buyers retain some control, but the decline indicates that bullish momentum has cooled.
The moving average convergence divergence indicator produced a bearish crossover. The MACD line dropped to 2,357, below the signal line at 2,956, while the histogram fell to minus 598.
The negative histogram shows that upward momentum is losing strength, although both main MACD lines remain above zero. Bitcoin would need renewed buying pressure to prevent the crossover from developing into a broader bearish reversal.
The Aroon indicator on the 4-hour chart also favored sellers. Aroon Down stood at 57.14%, compared with an Aroon Up reading of 21.43%, reflecting the recent pattern of lower highs and repeated tests of support.
Bitcoin remains below the 0.618 Fibonacci retracement level at $83,972. The level, calculated from the decline between $126,261 and $57,833, represents the main resistance separating the current recovery from a larger trend reversal.
Bitcoin liquidation map points to $77,300 support
CoinGlass’s one-week liquidation heatmap shows a concentration of leveraged positions immediately below the current price.
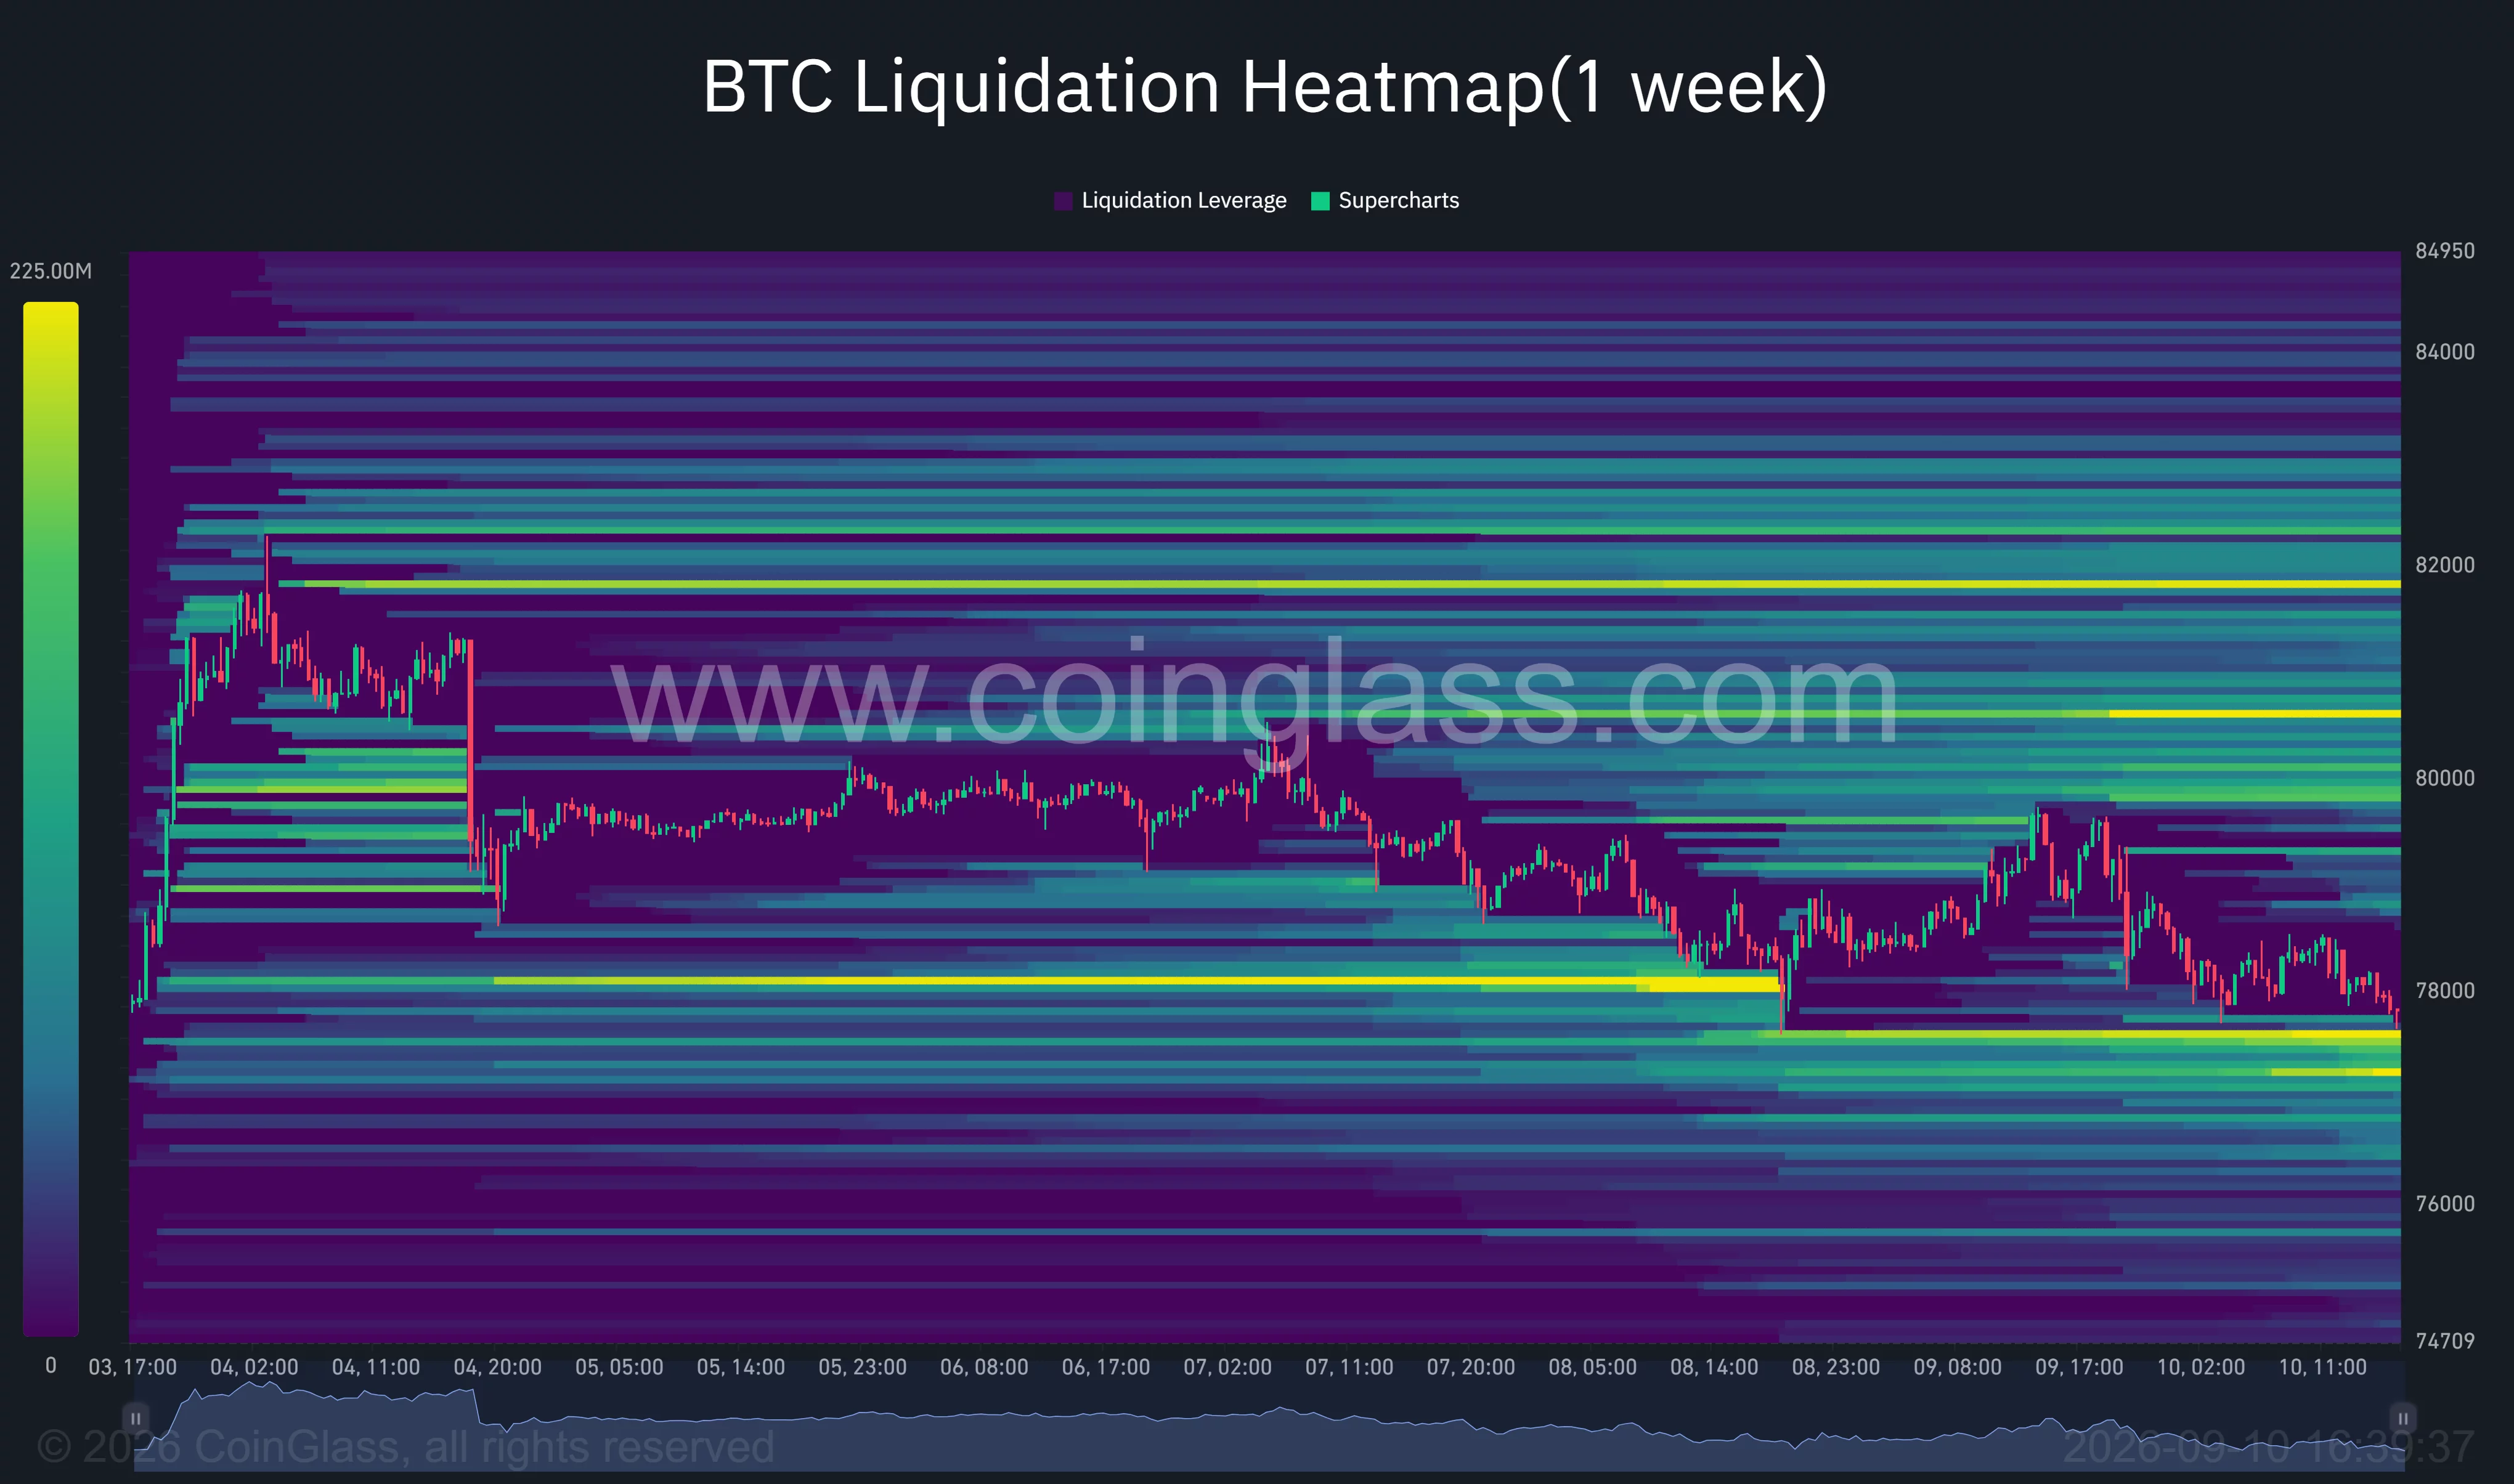
The closest large liquidity band sits between approximately $77,300 and $77,600. A decline into the area could trigger additional long liquidations, but it may also attract buyers seeking a sweep of the recent lows.
Trader Lennaert Snyder said he was watching for Bitcoin to take out the $77,600 low and possibly test $77,300 before forming a long setup. He identified the area as an extreme of the weekly range and said a successful liquidity sweep could support a recovery toward $80,000.
The daily chart places the next major technical support at the 78.6% Fibonacci retracement near $72,477. Before that level comes into play, buyers may attempt to defend the wider $76,000 to $77,000 range that has contained several recent declines.
Above the market, the heatmap shows notable liquidation clusters near $80,500 and $81,800. A recovery through $80,000 could force short positions to close and accelerate a move toward those pools.
Snyder identified the $80,000 region as a possible area for new short setups if Bitcoin tests it without establishing support. His view keeps the immediate trading range between roughly $77,300 and $80,000.
Bitcoin, therefore, remains caught between nearby long-liquidation risk below and larger short-liquidation pools above. A confirmed daily close outside the $76,000 to $81,000 range would provide clearer evidence of its next direction.
Disclosure: This article does not represent investment advice. The content and materials featured on this page are for educational purposes only.
