



Solana has slipped back toward the mid-$80 range after repeated rejections near $100 triggered fears of a deeper correction below the critical $80 support zone.
Summary
- Solana price has remained below the key $90 resistance zone after falling nearly 15% from its recent high near $100, with traders watching the $80 support area closely.
- Daily charts show a developing double-top pattern, while CoinGlass liquidation data highlights dense leverage clusters between $83 and $78 that could accelerate downside volatility.
- Weakening Solana DEX activity, institutional outflows, and persistent macro uncertainty tied to inflation fears and Middle East tensions have continued pressuring sentiment across altcoins.
According to data from crypto.news, Solana (SOL) price was trading near $85 at press time after falling roughly 15% from its early-May peak near $100.
The decline came as institutional appetite for risk assets has weakened sharply over the past two weeks. U.S.-based crypto investment products recorded more than $1 billion in weekly outflows recently as investors reduced exposure ahead of upcoming Federal Reserve commentary and inflation data.
Solana-linked products were among the hardest hit after Goldman Sachs disclosed that it had exited several Solana and XRP exchange-traded product positions, reinforcing concerns that institutional capital continues rotating away from speculative altcoin exposure.
On-chain metrics have also deteriorated. Solana’s decentralized exchange activity has cooled significantly following the slowdown in meme coin trading volumes that previously fueled aggressive network growth earlier this year. Weekly DEX volume on the network has dropped more than 50% from recent highs, reducing fee generation and weakening demand for SOL as transactional activity declines across the ecosystem.
At the same time, rival ecosystems have started attracting liquidity that previously flowed into Solana-based applications. Base and Hyperliquid have seen increasing trader activity due to lower costs and strong perpetual trading demand. Hyperliquid, in particular, has emerged as a major competitor in decentralized derivatives, pulling both liquidity and speculative volume away from Solana-native platforms.
Meanwhile, oil market volatility and geopolitical uncertainty continue adding pressure to crypto markets. Brent crude prices remain elevated following renewed concerns surrounding shipping disruptions near the Strait of Hormuz, while investors continue monitoring negotiations between the U.S. and Iran. Higher energy prices have complicated expectations for Federal Reserve rate cuts, reducing appetite for speculative assets like Solana.
Is a double-top pattern pointing to another major Solana breakdown?
Technical indicators are increasingly pointing toward a fragile market structure after Solana failed twice to break above the $98–$100 resistance region. The daily chart shows a developing double-top pattern, with both rejection points occurring near the same supply zone before SOL price retreated back toward the mid-$80 range.
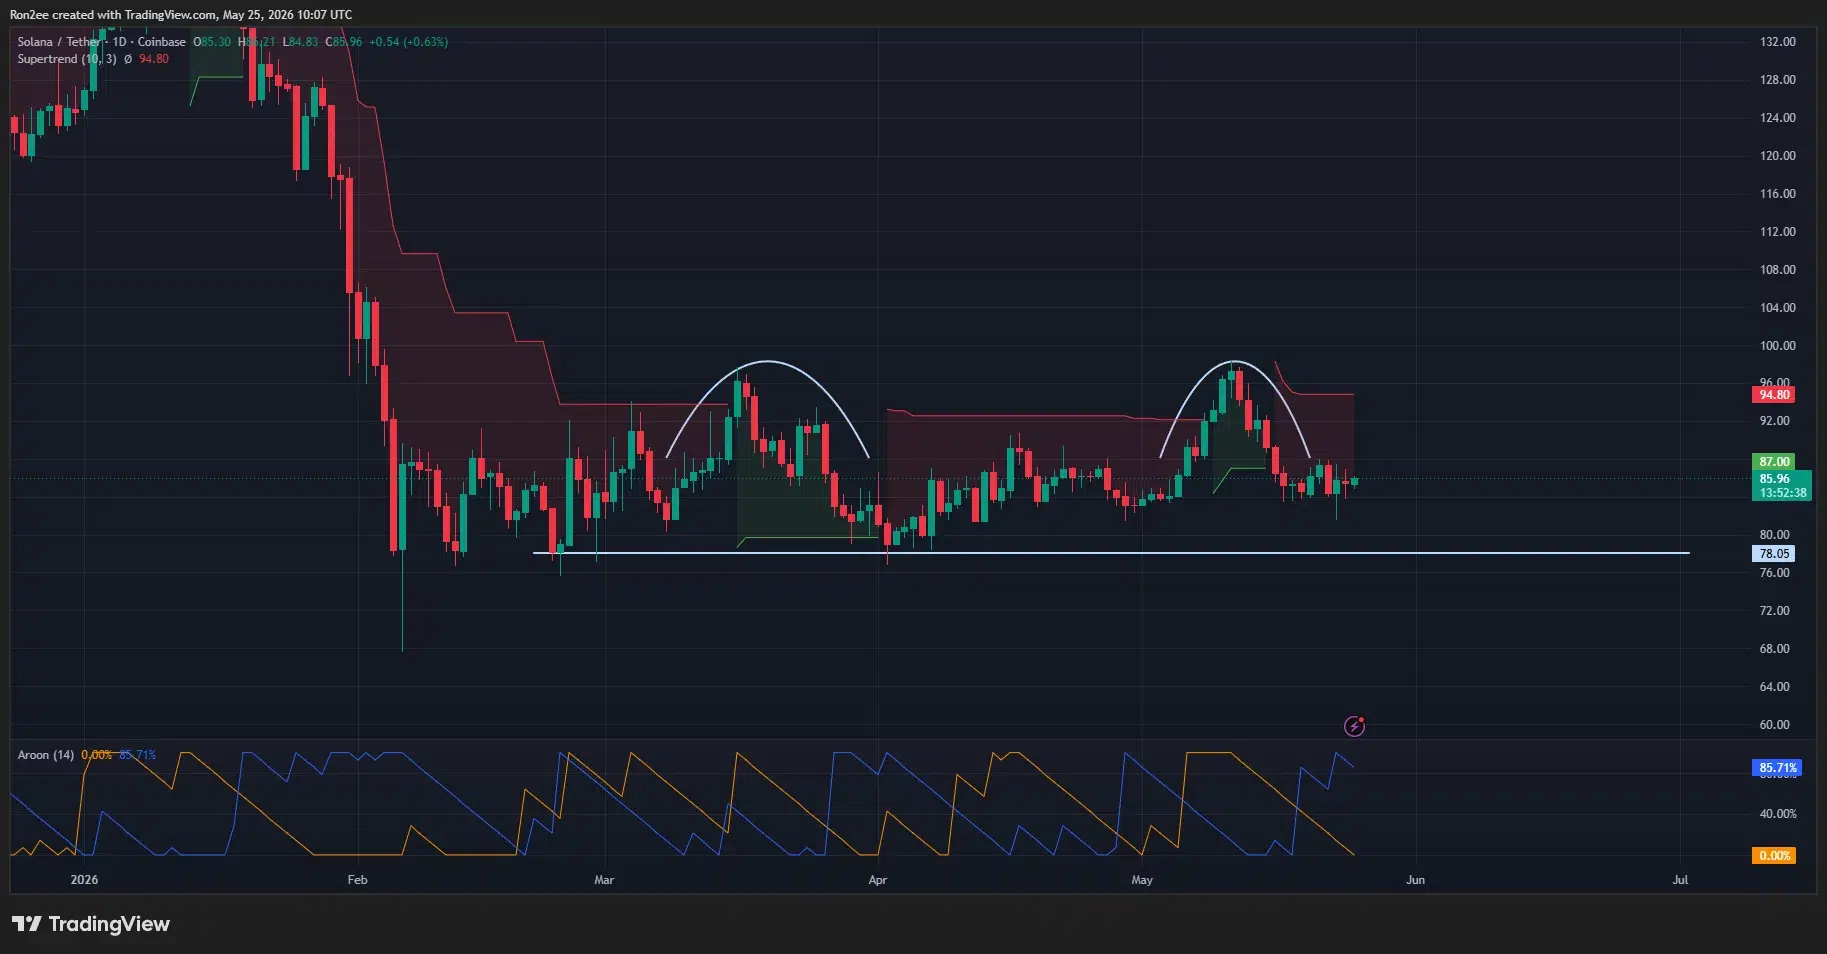
The neckline support for the structure sits near the $78 level, which has repeatedly acted as a key defensive area since March. A confirmed breakdown below that region could validate the bearish pattern and potentially open the door for a larger move toward the low-$70 range.
Pattern projections derived from the height of the structure suggest downside targets could extend toward $64 if panic selling accelerates.
Alongside the double-top formation, Solana remains below its Supertrend resistance near $94.80, indicating that sellers continue controlling the higher timeframe trend. Daily candles have also struggled to close above the descending resistance band formed after the late-April rejection, keeping bullish momentum suppressed.
Momentum indicators remain mixed but continue to favor bears overall. The Aroon indicator shows Aroon Up near 85.7% while Aroon Down remains near zero, signaling that short-term rebounds are still occurring. However, the indicator has historically produced several failed bullish signals during Solana’s prolonged consolidation phase this year, limiting confidence in a sustained recovery attempt.
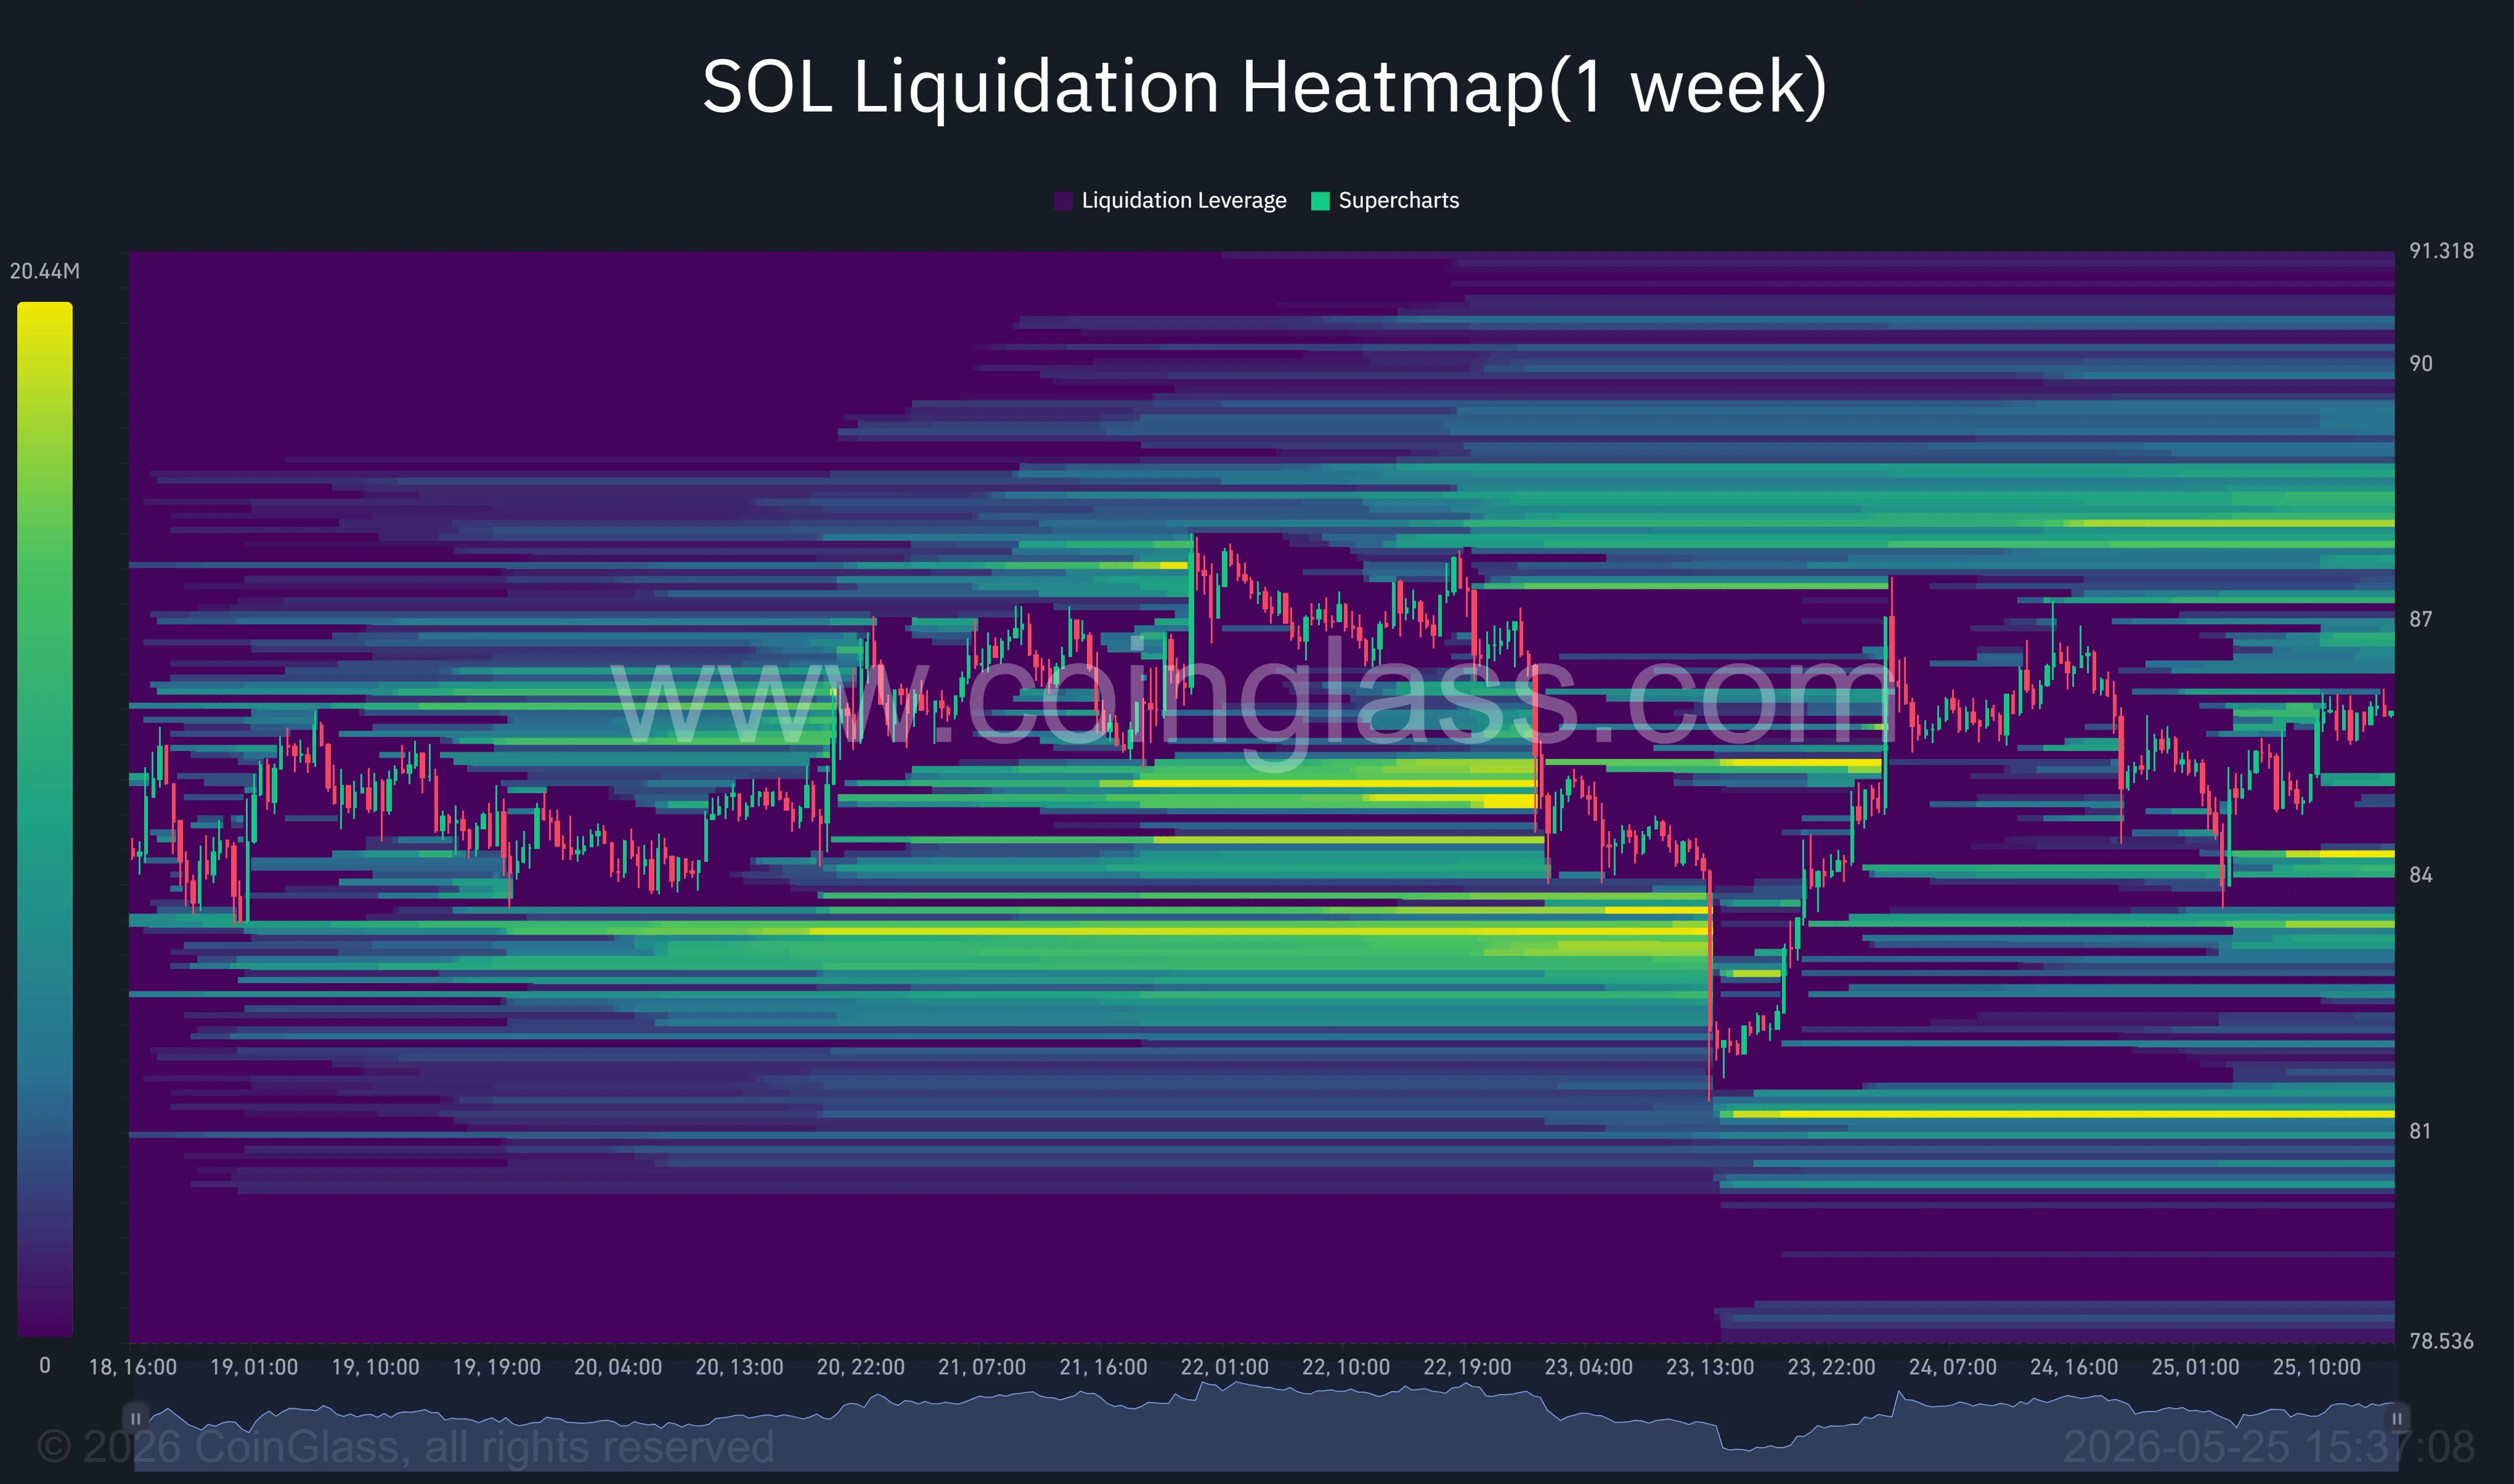
CoinGlass liquidation heatmap data shows dense leverage clusters concentrated between $83 and $81, with another major liquidity pocket sitting near $78. Those zones could become magnets for price action if volatility increases during the coming sessions.
Funding rates across perpetual futures markets have also turned deeply negative, indicating aggressive short positioning from traders expecting additional downside. Negative funding often signals bearish sentiment dominance, particularly when paired with weakening spot demand and falling network activity.
Open interest has remained elevated despite recent price weakness, a combination that often precedes sharp liquidation-driven moves.
If Solana loses the $83 support floor decisively, cascading long liquidations could accelerate the decline toward the psychological $80 threshold very quickly.
Analyst DonAlt warned that Solana’s current structure resembles conditions seen before previous major drawdowns. In a recent market update, he said the setup “looks very similar to Q3 2022,” adding that a temporary bull trap could emerge before another deeper correction.
The trader suggested Solana could eventually revisit the $47 region in a worst-case capitulation scenario if market conditions continue deteriorating.
Despite the bearish setup, buyers have continued defending the $83–$84 area aggressively during recent sessions. Several long lower wicks on the daily timeframe indicate dip-buying activity remains active near support, preventing a clean breakdown so far.
What could invalidate the bearish Solana thesis?
A sustained recovery above the $90 resistance zone would weaken the immediate bearish structure and potentially force short sellers to unwind positions. CoinGlass liquidity data shows a heavy concentration of short liquidation levels above $87 and $90, meaning a breakout could trigger a rapid squeeze higher if momentum returns.
Improving macro conditions could also stabilize risk appetite across crypto markets. Softer-than-expected U.S. inflation data or any signals that the Federal Reserve may ease policy later this year would likely support renewed inflows into altcoins. Bitcoin reclaiming higher resistance zones could similarly improve sentiment toward Solana and other large-cap cryptocurrencies.
Network activity remains another critical variable. Any revival in meme coin trading volumes or a sharp rebound in Solana-based decentralized finance activity could improve fee generation and restore speculative demand for SOL. Developers also continue expanding infrastructure across the ecosystem despite the recent slowdown in user activity.
For now, however, the technical structure remains vulnerable while macro conditions continue to favor defensive positioning.
Unless bulls reclaim the $90–$94 resistance range soon, Solana risks slipping below the critical $80 threshold as traders continue pricing in weaker liquidity conditions and rising downside pressure across the crypto market.
Disclosure: This article does not represent investment advice. The content and materials featured on this page are for educational purposes only.
