


Bitcoin price has fallen 1.4% from an intraday high of $66,300 to $65,368 as rising oil prices, renewed U.S.-Iran tensions, and regulatory uncertainty have pushed traders toward a more defensive stance.
Summary
- Bitcoin price has retested $65,000 as rising oil prices and geopolitical tensions pressure risk assets.
- ETF inflows support demand, but 4-hour momentum has weakened below the $66,800 resistance.
- Losing $65,000 could expose liquidity near $64,500 before the $63,170 moving-average support.
The decline erased part of Bitcoin’s recent recovery and brought the $65,000 support level back into focus. Selling accelerated after BTC failed to hold above $66,000, while the Fear and Greed Index remained in neutral territory as traders weighed institutional inflows against fresh macroeconomic risks.
Political uncertainty added to the pressure after Senate Democrats objected to parts of the latest Digital Asset Market Clarity Act proposal. Polymarket traders had lowered the probability of the bill becoming law in 2026 to about 37% earlier this week as ethics rules and investor protections remained unresolved.
At the same time, BitMEX announced that it would close its derivatives exchange on Sept. 23 following a strategic review by parent company HDR Global Trading. The platform stopped accepting new registrations and asked customers to close positions and withdraw their assets before operations end.
Institutional flows have provided some support during the pullback. U.S. spot Bitcoin exchange-traded funds recorded $69 million in net inflows on July 22, their seventh consecutive positive session, according to SoSoValue data. The seven-day streak brought combined inflows to about $1 billion, although July’s additions remained below the $6.9 billion withdrawn in May and June.
Oil and geopolitical risks are testing demand at $65,000
West Texas Intermediate crude climbed nearly 4% to around $90 a barrel on July 23, extending its advance for a fifth session. Brent rose close to $99 as attacks on Saudi oil tankers and threats against regional energy infrastructure raised fears of supply disruptions.
The UK Maritime Trade Operations agency reported that a tanker caught fire after it was struck southwest of Al Shuqaiq. Yemen’s Houthi rebels later claimed attacks on two Saudi tankers, saying the vessels had violated their maritime blockade.
President Donald Trump also warned that Washington would strike an Iranian bridge or power plant each time Tehran attacked a vessel in the Strait of Hormuz. Iranian authorities responded with threats against U.S.-linked infrastructure and energy assets across the region if Washington carried out those attacks.
Higher energy costs could keep U.S. inflation elevated and limit the Federal Reserve’s room to lower interest rates. Treasury yields may rise if traders expect tighter policy for longer, a development that could hurt demand for Bitcoin and other assets that do not offer a fixed yield.
Technology stocks have supplied another risk factor as investors assess Alphabet’s increased spending on artificial intelligence infrastructure. Weakness across high-growth equities often spills into Bitcoin because both markets attract investors who are sensitive to interest rates and changes in liquidity.
Bitcoin retains its rising channel while momentum weakens
Bitcoin’s 4-hour chart shows that price remains inside an ascending channel that began near $57,800 in early July. The lower trendline now runs through the $65,000–$65,400 area, making the current retest important for the short-term recovery.
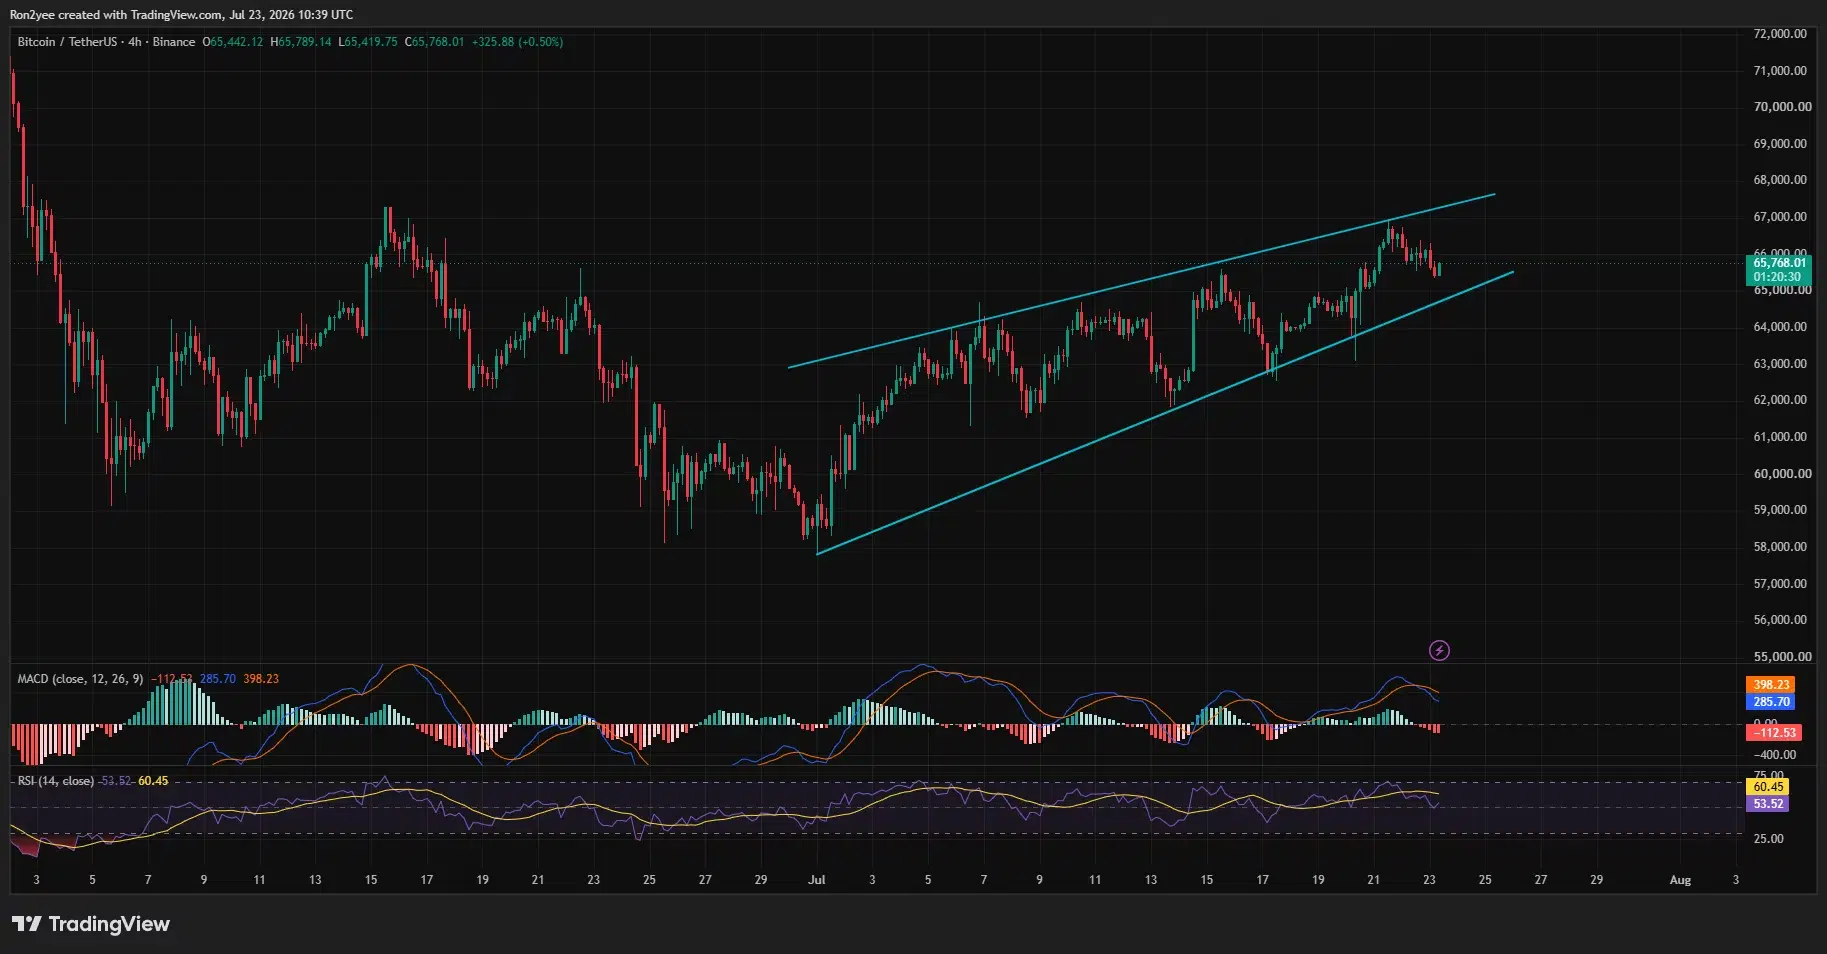
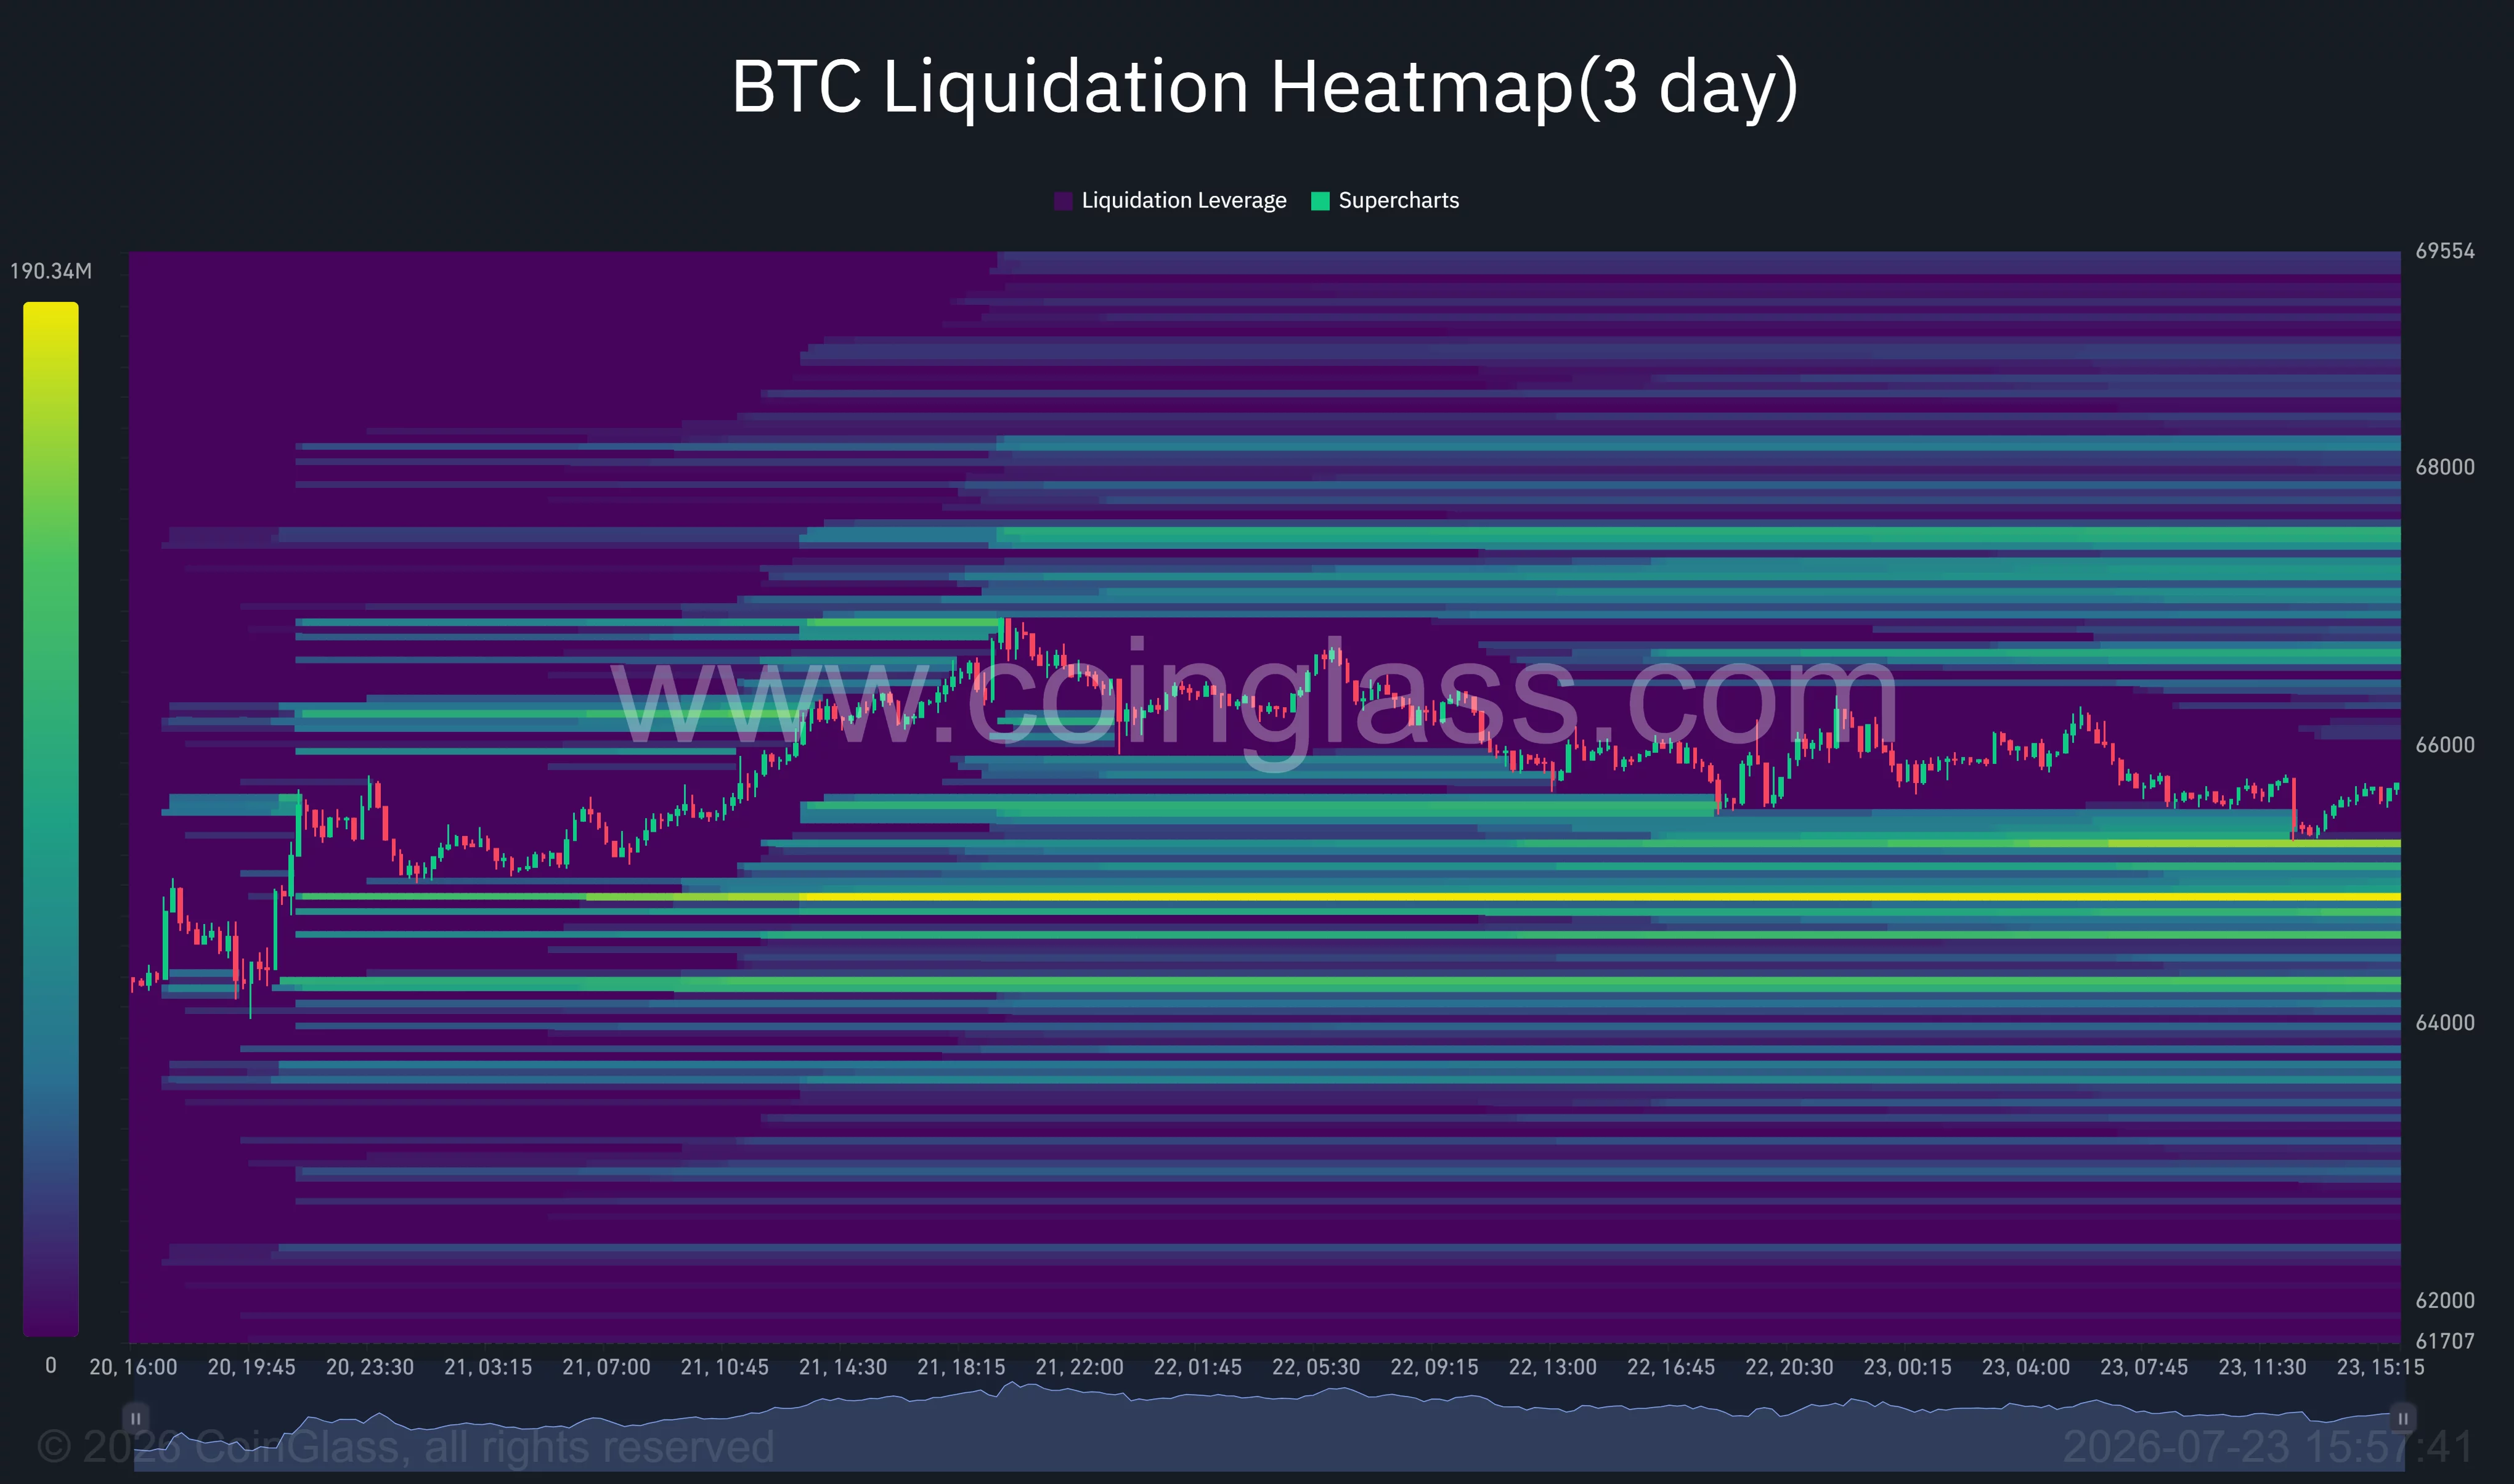
A successful defense could allow BTC to revisit $66,800, where the latest rally stalled, followed by the channel ceiling near $67,500. The three-day liquidation heatmap shows concentrated short-liquidation between $66,500 and $67,300, with another large cluster near $68,100.
Commenting on the setup, crypto trader Ted Pillows noted that Bitcoin could advance toward $67,500–$68,000 as long as $65,000 holds.
“BTC is having a correction but still holding above the $65,000 level. As long as this holds, Bitcoin could rally towards $67,500–$68,000 soon.”
Analyst Lennaert Snyder offered a more cautious view after retaining a short position from the $67,000 region. Snyder identified a possible long entry only after a sweep below $65,000 and kept $68,100 as an upside target that would require confirmation.
Momentum has weakened on the 4-hour chart. The MACD line has dropped to 285.70, below the signal line at 398.23, while the histogram has moved to minus 112.53. The relative strength index has fallen to 53.52 from above 60, leaving momentum positive but no longer strong enough to confirm an immediate breakout.
On the daily chart, Bitcoin trades above the 20-day simple moving average at $64,232 and the 50-day average at $63,171. Those levels support the recovery structure, but BTC remains below the 100-day and 200-day averages at $70,044 and $72,602, respectively.
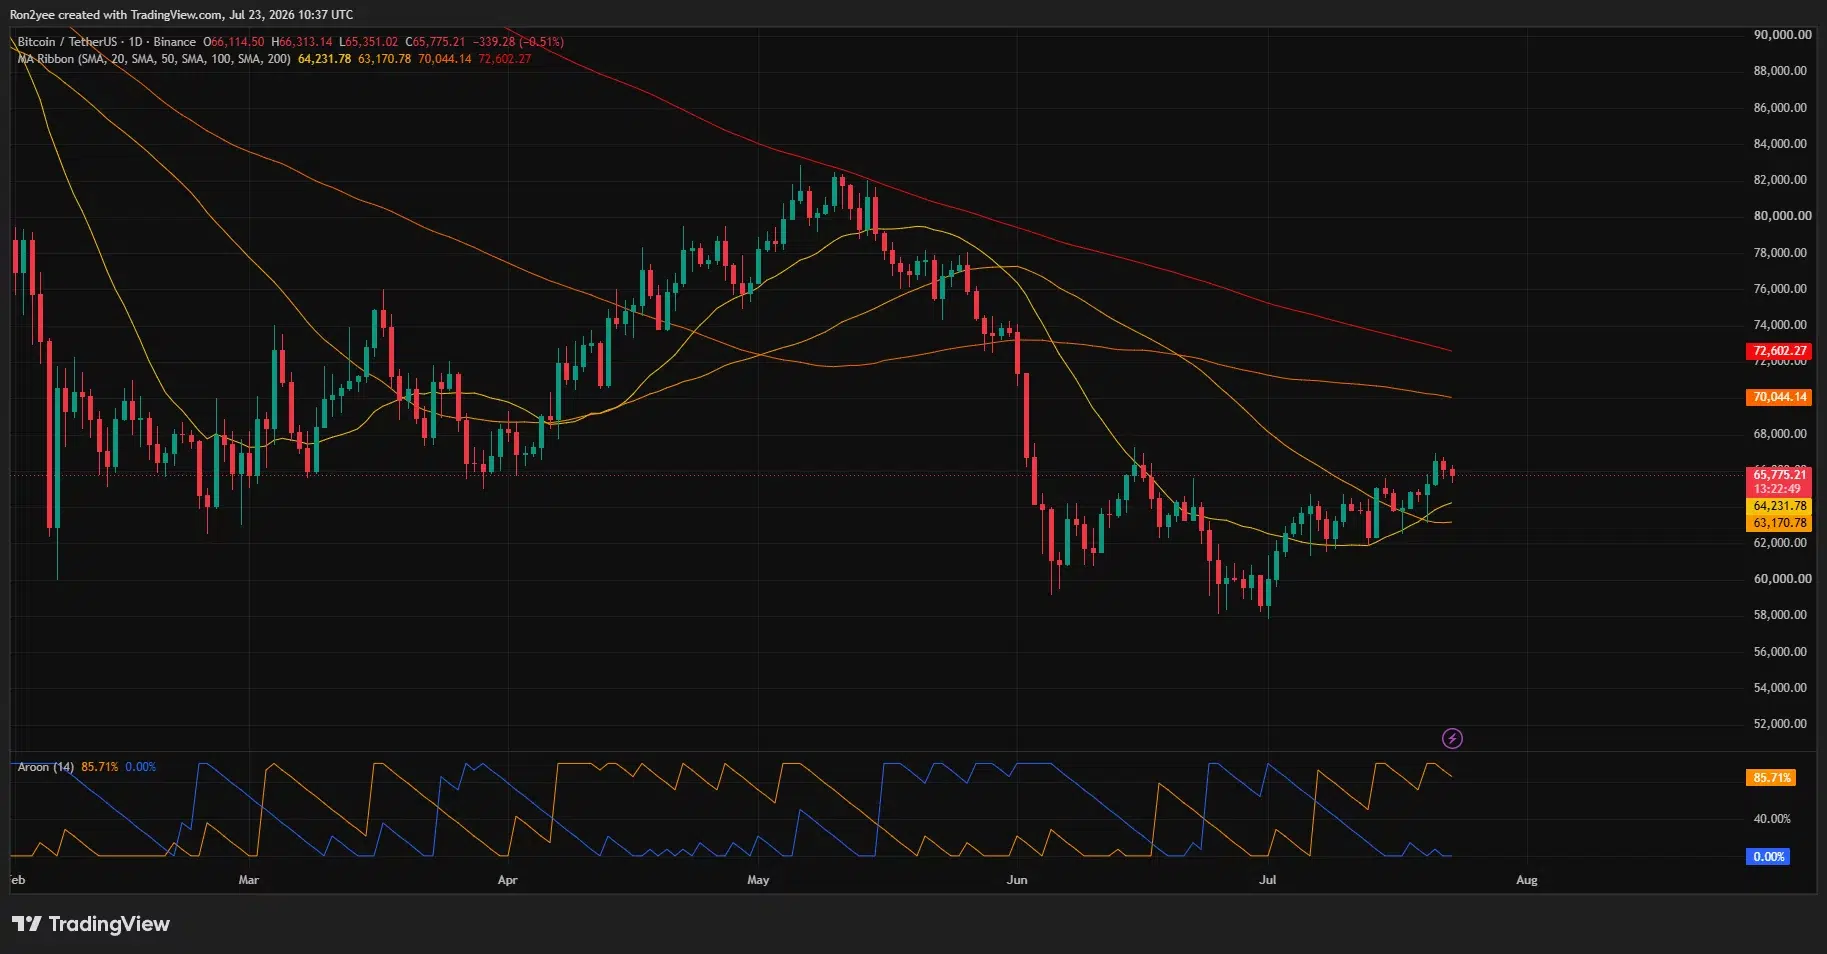
The daily Aroon Down reading has climbed to 85.71%, while Aroon Up has dropped to zero, which gives sellers control despite the recent rebound. A daily close above $66,800 would weaken that bearish reading and open a path toward $68,000 and the 100-day average.
Downside risk would increase if Bitcoin closes below the channel floor and loses $65,000. The heatmap places leveraged-long liquidity around $64,800, $64,500 and $64,000, while the moving averages create another support band between $63,170 and $64,230.
A break below $63,170 would invalidate the short-term recovery and expose $61,500, followed by the late-June floor near $59,000. Further oil gains, higher Treasury yields, or another escalation involving Iran could speed up that move even if ETF inflows remain positive.
Disclosure: This article does not represent investment advice. The content and materials featured on this page are for educational purposes only.
