



Solana price surged 25% over the past week and briefly reached $93.39 on Aug. 21 as a market-wide short squeeze pushed SOL above its major moving averages. The breakout has opened a path toward $98 and $100, although an overbought daily reading raises the risk of a short-term pullback.
Summary
- Solana price climbed 25% in one week and traded near $92 after reaching $93.39.
- SOL broke above its 20-day, 50-day, 100-day, and 200-day moving averages.
- The daily relative strength index reached 81.74, placing SOL deep in overbought territory.
- Liquidation data shows nearby liquidity around $93–$95, followed by support near $90 and $88.
Solana price breaks out of a two-month range
According to data from crypto.news, Solana (SOL) price was trading near $92 at the time of writing, up almost 5% on the day after moving between $87.57 and $93.39. The advance extended its weekly gain to approximately 25% and carried the token out of the range that had controlled its price since June.
The daily chart shows SOL breaking above the $76–$78 resistance zone, where several recovery attempts had failed during July and early August. The move also cleared the previous swing high near $82, changing the short-term market structure from a series of lower highs to a higher high.
Trading activity expanded during the breakout, supporting the move beyond the former range. SOL has now returned to price levels last seen in May, when sellers repeatedly defended the area between $94 and $98.
The rally followed a broader cryptocurrency short squeeze that erased more than $4 billion in bearish positions over 48 hours. Solana’s faster rise relative to several large-cap assets reflected its tendency to record wider moves during changes in crypto market sentiment.
Short squeeze meets institutional and network catalysts
The derivatives-driven rally received additional support from Shinhan Asset Management’s announced partnership with the Solana Foundation. The South Korean asset manager plans to test a Korean won-denominated tokenized bond fund modeled on BlackRock’s BUIDL product.
The pilot adds to Solana’s effort to attract tokenized real-world assets and institutional financial products. However, its effect on SOL demand will depend on the fund’s eventual size, launch terms, and on-chain activity, none of which were established by the price charts.
Network activity also supported the bullish narrative after Solana reportedly processed 1.2 billion non-vote transactions in one week. A recent increase in the compute limit per block gave applications more capacity, while the planned Alpenglow upgrade aims to reduce finality times and change how validator votes are handled.
Broader US market conditions helped risk assets as well. The supplied market context linked the recovery to increased US Treasury buybacks, falling long-term yields, and a weaker dollar. Washington’s renewed push for the Digital Asset Market Clarity Act and the SEC’s proposed Regulation Crypto Assets framework also contributed to improving regulatory sentiment, though both initiatives still require further action before becoming final policy.
SOL’s overbought RSI warns against chasing
The daily chart confirms the strength of the breakout but also shows that momentum has become stretched. SOL’s 14-day relative strength index reached 81.74, well above the 70 level commonly associated with overbought conditions.
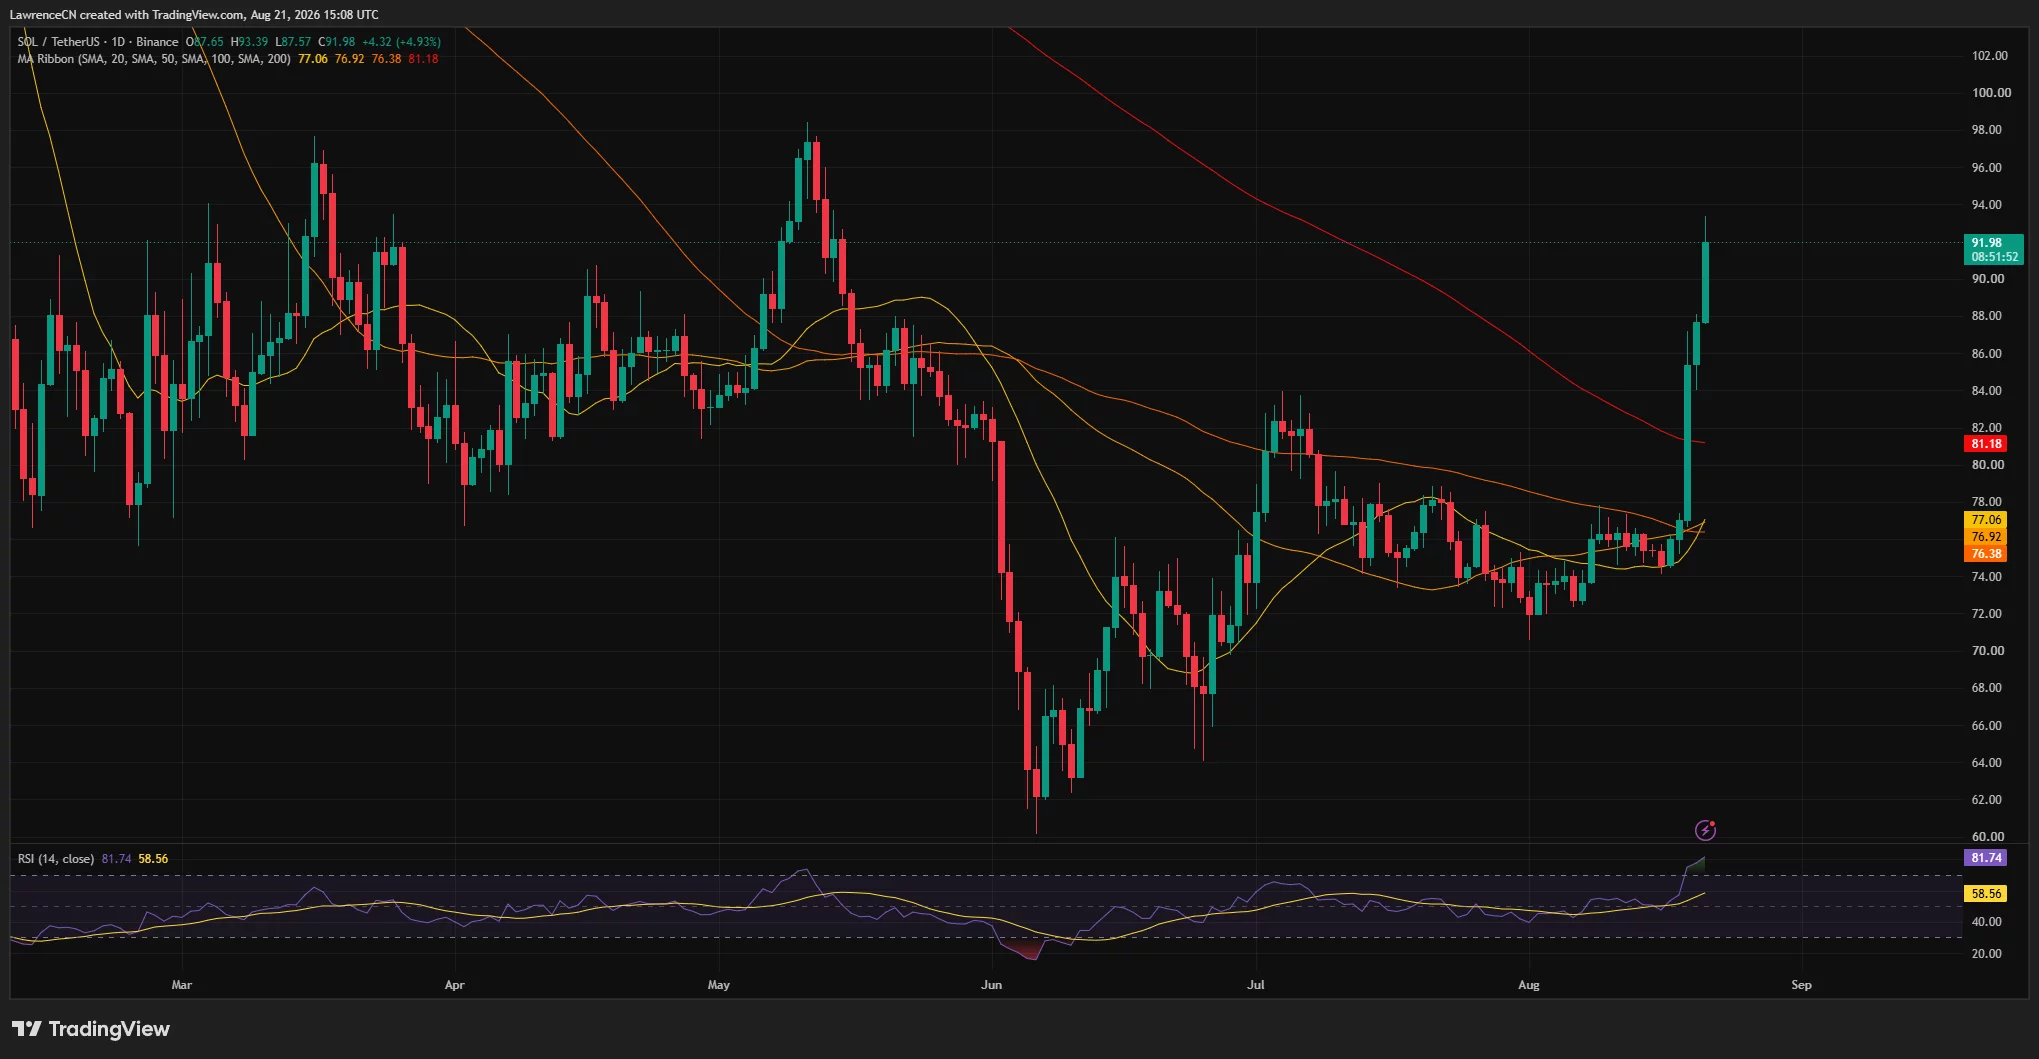
An overbought RSI does not require an immediate reversal. It does, however, show that price has risen much faster than its recent average and may need to consolidate before another sustainable advance.
SOL now trades above its 20-day simple moving average at $77.06, its 50-day average at $76.92 and its 100-day average at $76.38. The token also cleared the 200-day average near $81.18, which had acted as the most important long-term barrier on the chart.
The tight grouping of the shorter averages around $76–$77 identifies the base of the breakout. A later decline into that region would represent a full retest, although nearer support sits at $87–$90.
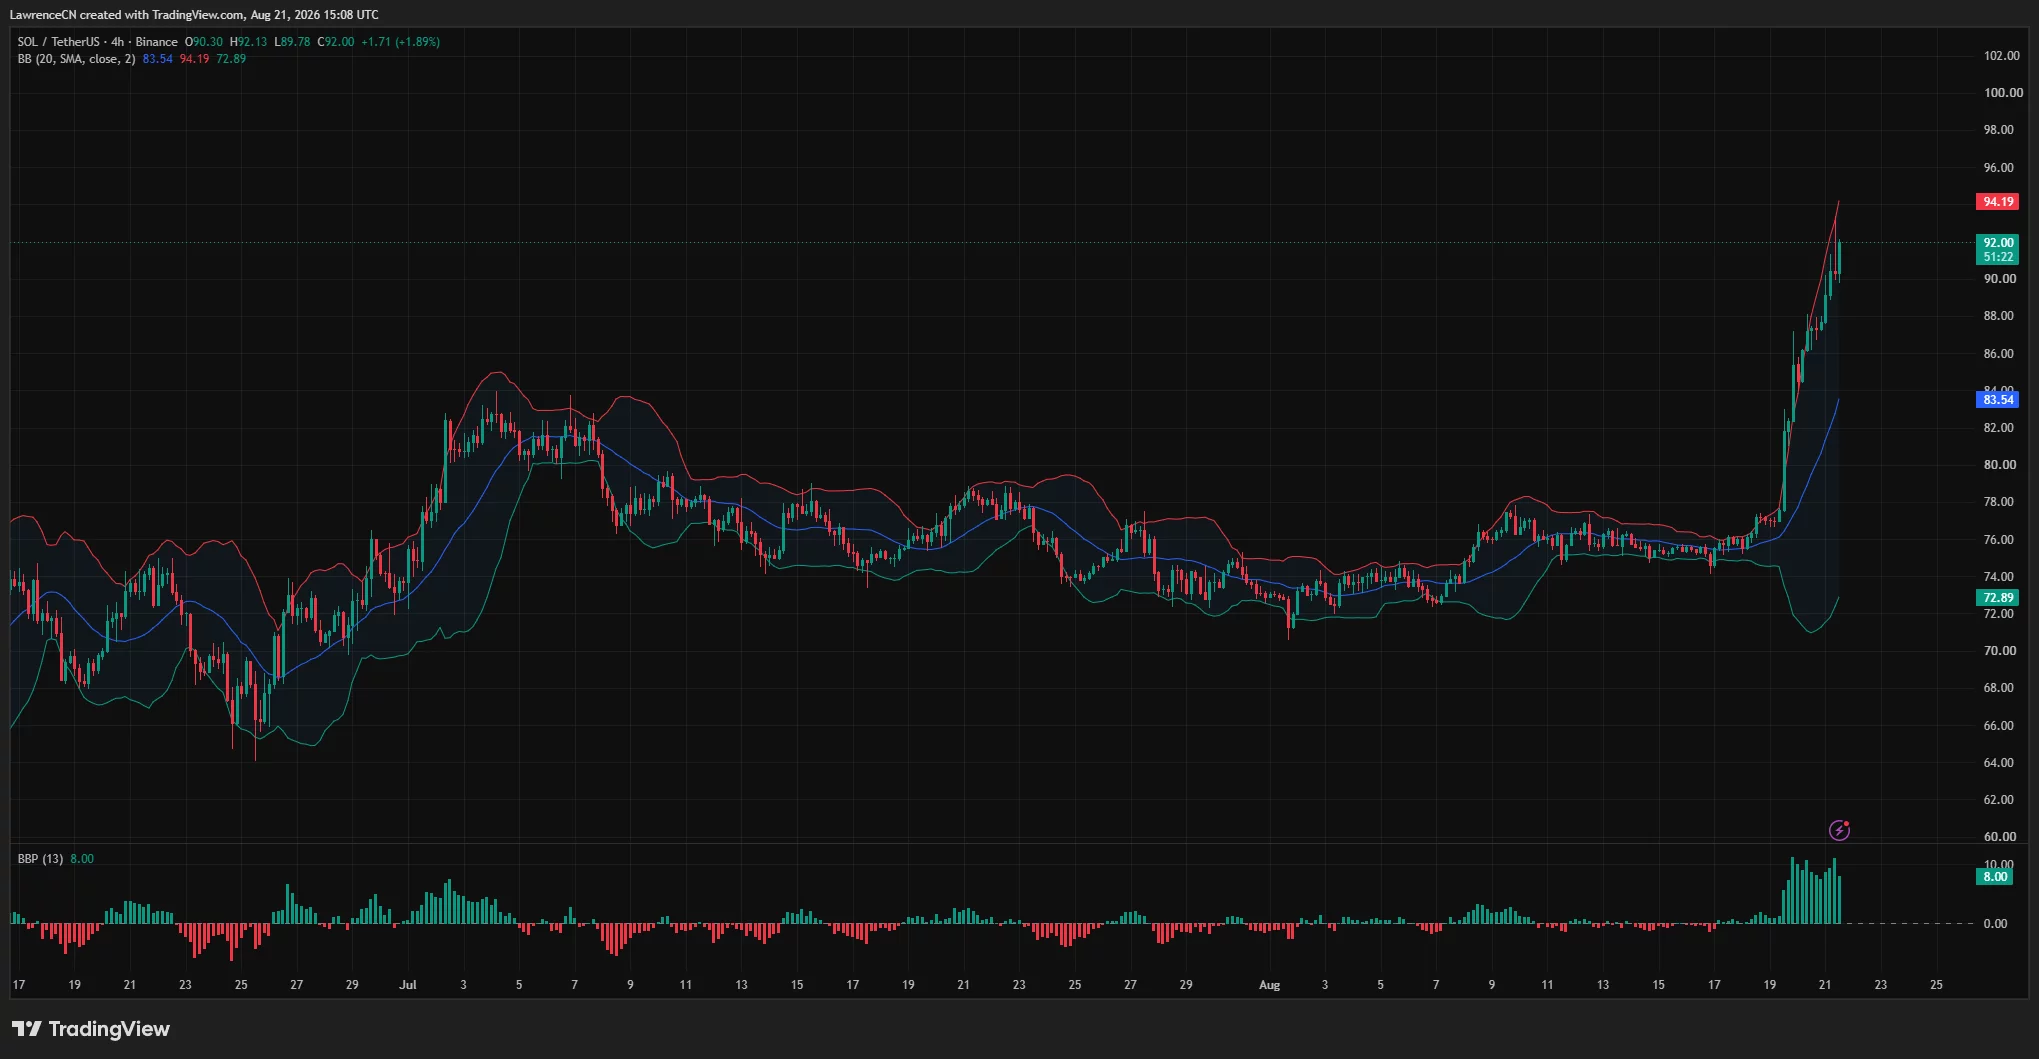
The 4-hour chart shows similarly stretched conditions. SOL traded near $92 while the upper Bollinger Band stood at $94.19. The middle band was much lower at $83.54, showing how quickly the price separated from its recent mean.
Solana liquidation map puts $95 and $98 in focus
The three-day CoinGlass liquidation heatmap shows SOL climbing through several layers of short liquidity between $80 and $92. Forced purchases from liquidated short positions likely helped accelerate the near-vertical move.
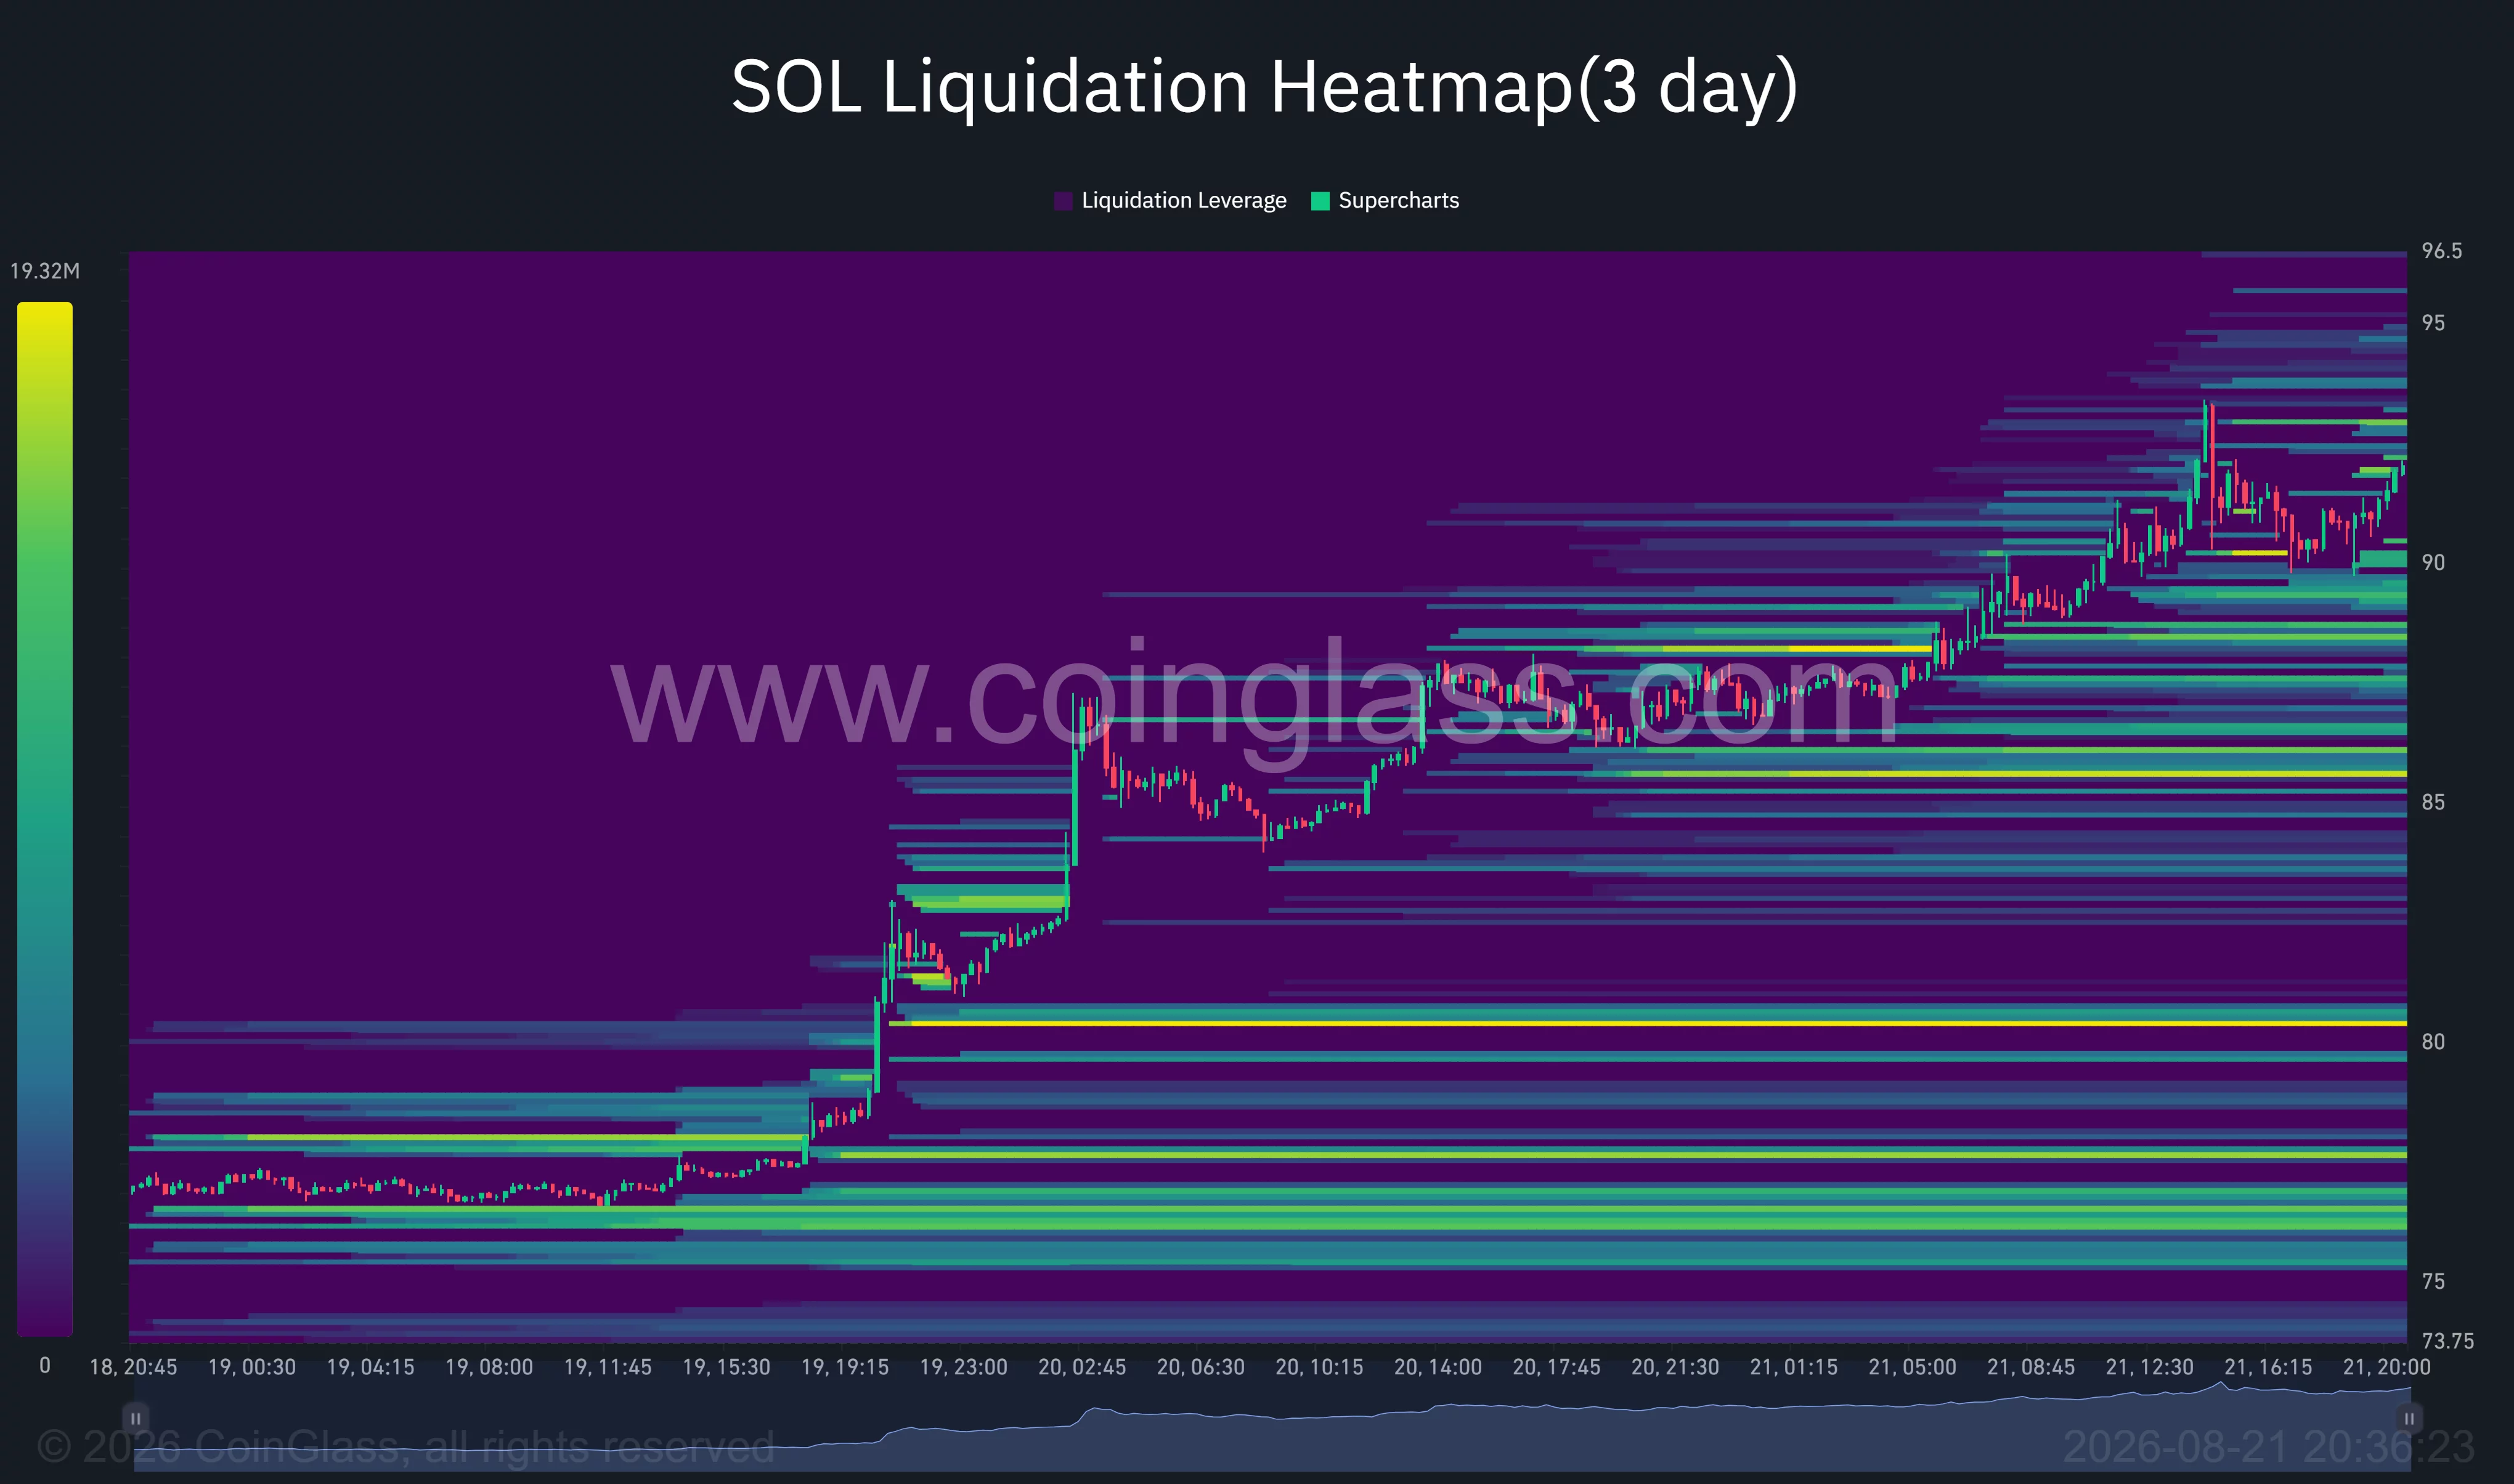
Remaining liquidity appears concentrated immediately above the market between roughly $93 and $95. A break through that area could produce another burst of forced buying, but the chart shows less dense liquidity once SOL moves beyond $95.
Crypto trader Daan Crypto Trades identified approximately $98 as the next range high and said another squeeze could develop if SOL reaches the equal highs around that level. His chart places the larger range between about $67.60 and $97.60.
Altcoin Sherpa offered a similar bullish view, naming $95 as the first target and $120 as a possible later objective if Bitcoin remains strong. Both projections are conditional forecasts rather than confirmed outcomes, and SOL must first hold its breakout.
The heatmap also shows downside liquidity near $90, $88, and $86. The $86 area contains one of the brighter nearby clusters and could attract price if buyers fail to defend $90. A larger concentration remains around $80–$81, close to the daily 200-day moving average.
A $100 breakout depends on holding $87–$90
SOL’s immediate bullish scenario requires a sustained close above the $93–$95 region. Clearing that zone would expose the May range high near $98, followed by the psychological $100 level.
A confirmed move above $100 could strengthen the case that the longer decline from SOL’s 2025 peak has ended. The next target cited by Altcoin Sherpa is $120, but the current charts do not yet confirm that extension.
The bearish scenario starts with rejection below $95 and a loss of $90. Such a move could return SOL to $87–$88, while a deeper correction would bring the 4-hour Bollinger midpoint near $83.54 and the 200-day average near $81.18 into focus.
For US investors, Treasury yields, dollar strength, and progress on federal crypto legislation remain relevant outside catalysts. SOL’s immediate direction, however, will likely depend on whether spot buying can replace the forced purchases that powered the initial squeeze.
Disclosure: This article does not represent investment advice. The content and materials featured on this page are for educational purposes only.
